
Portfolio Returns
I have condifence in my design of stratgies so I follow the signal of my strategies to make personal investment in the Chinese stock market, and here is the demonstratino of the return of my portfolio, which would be updated on a monthly basis.
Here is the curve of the returns. Suppose you start at 100, and you calculate the net worth of the broker account each day, and the cumulating return can be presented as (net worth -100)%.
Performance Summary
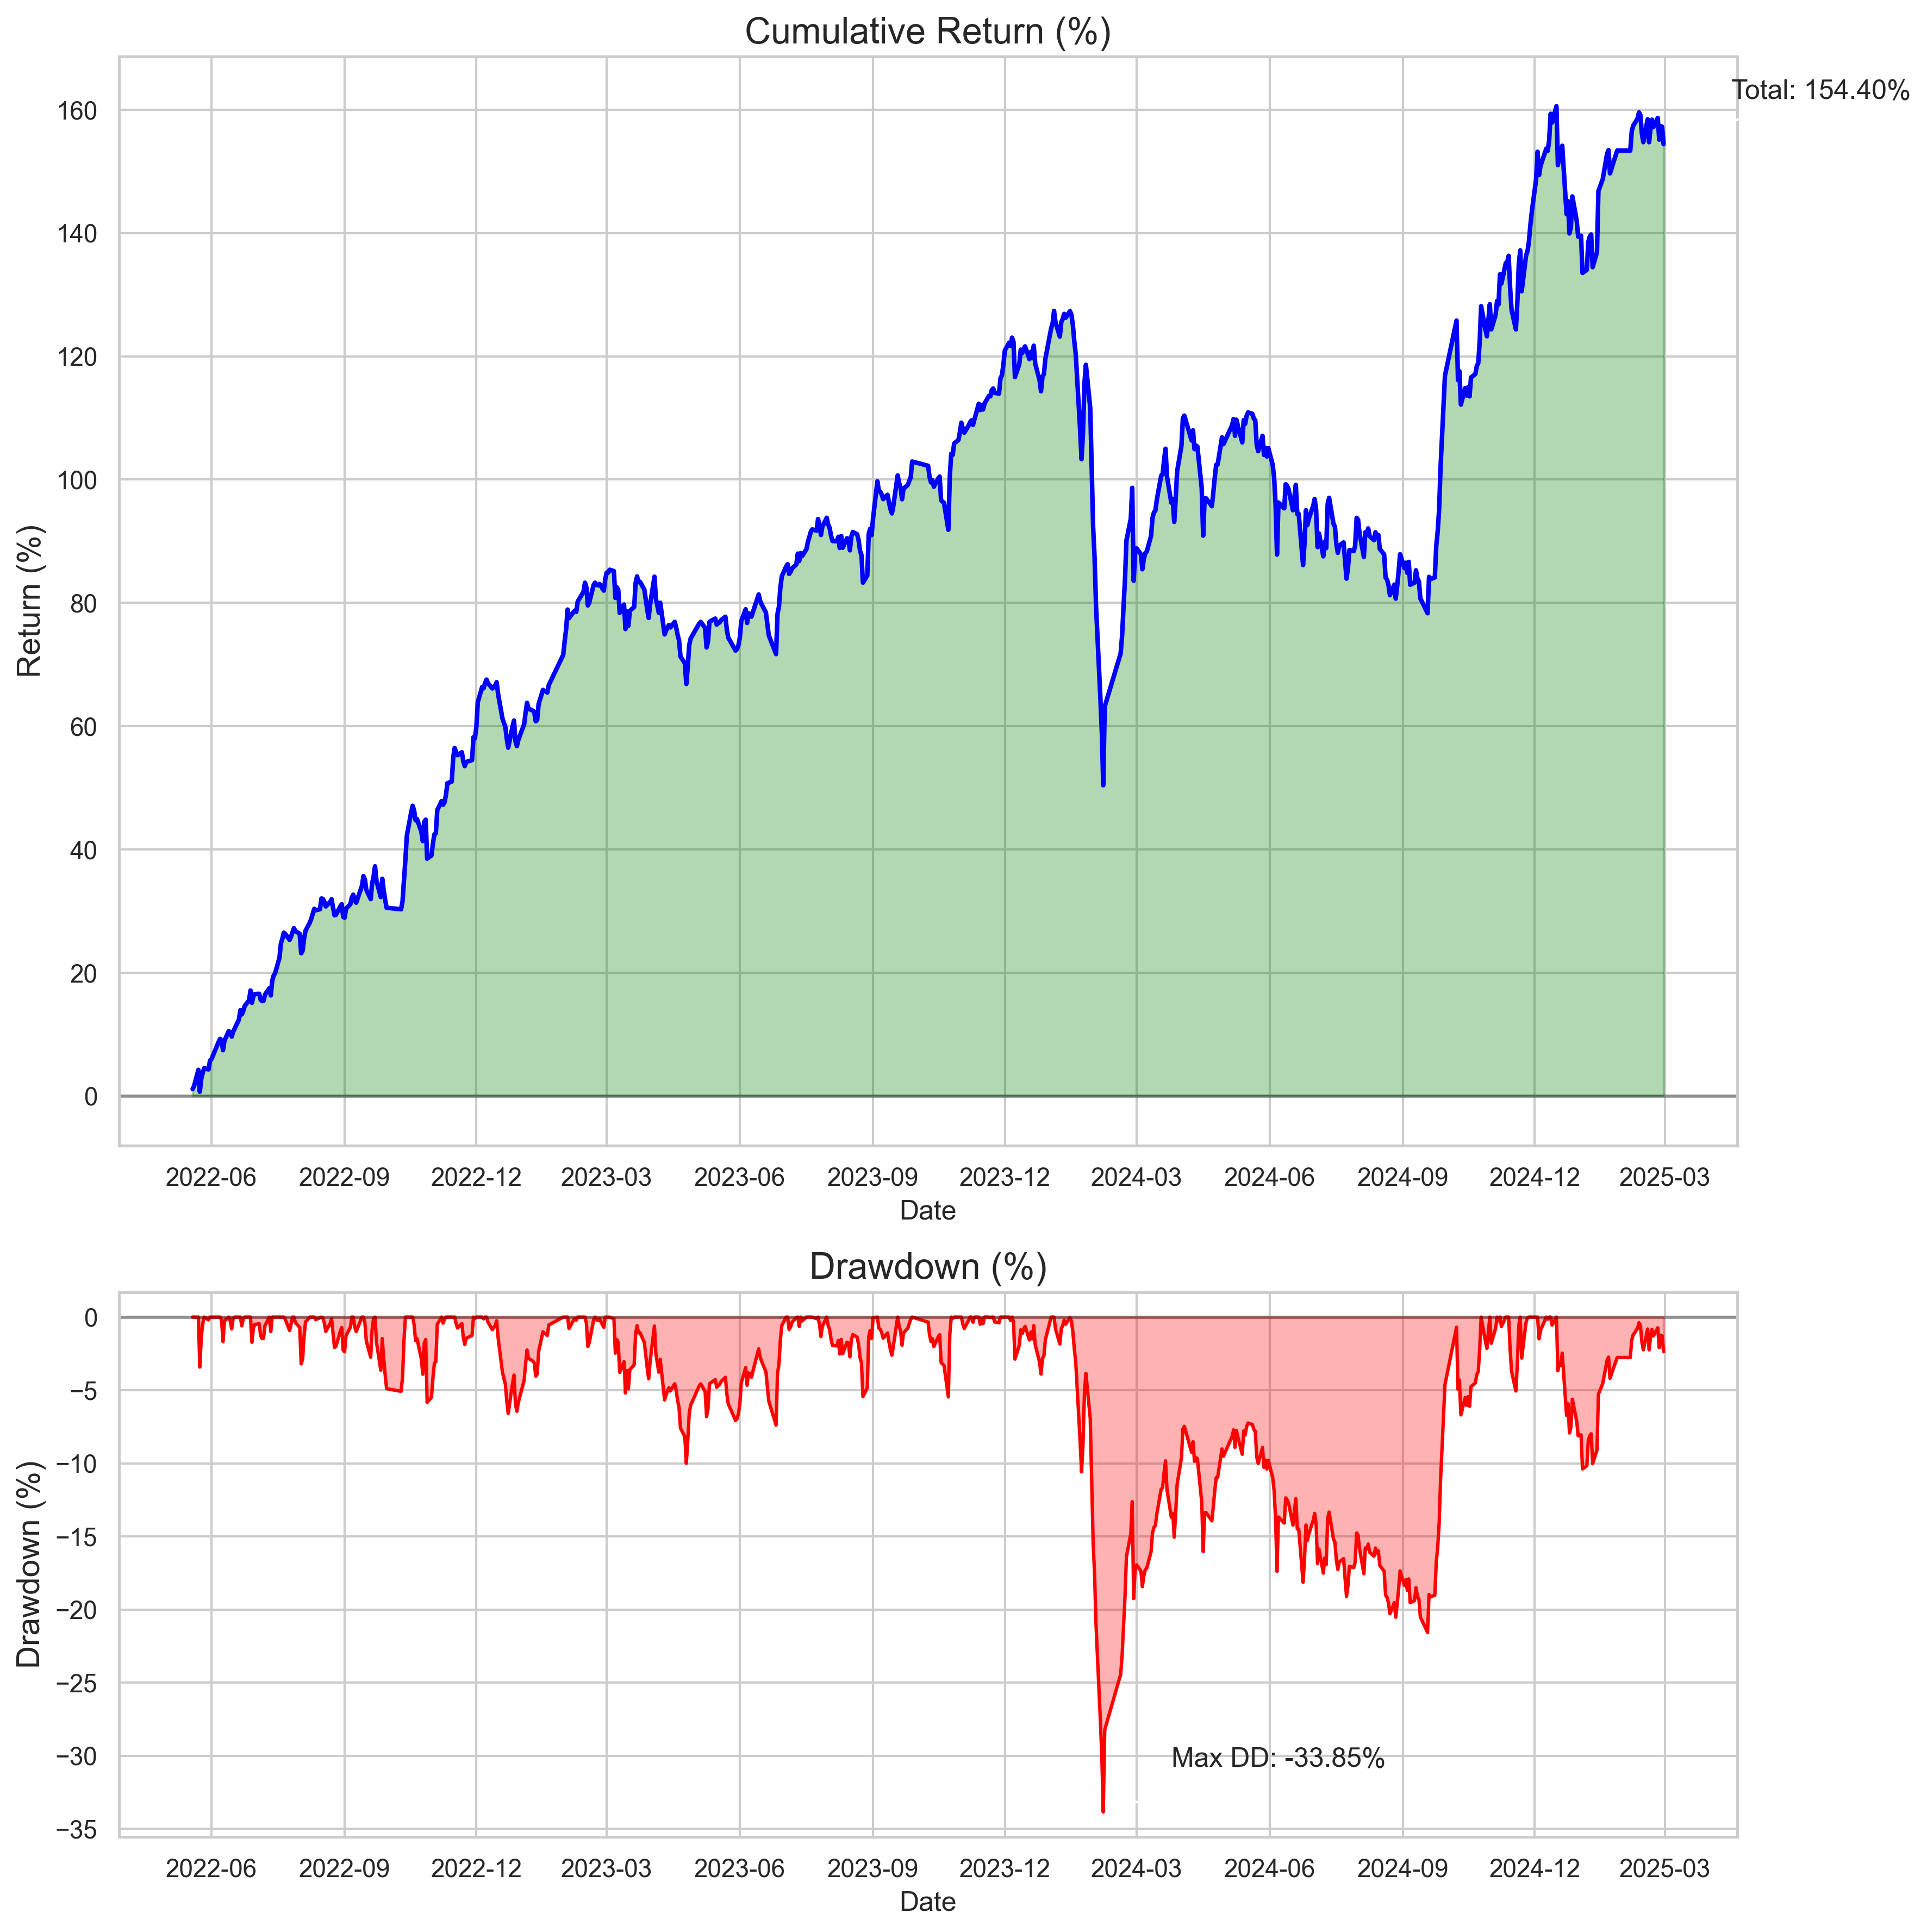
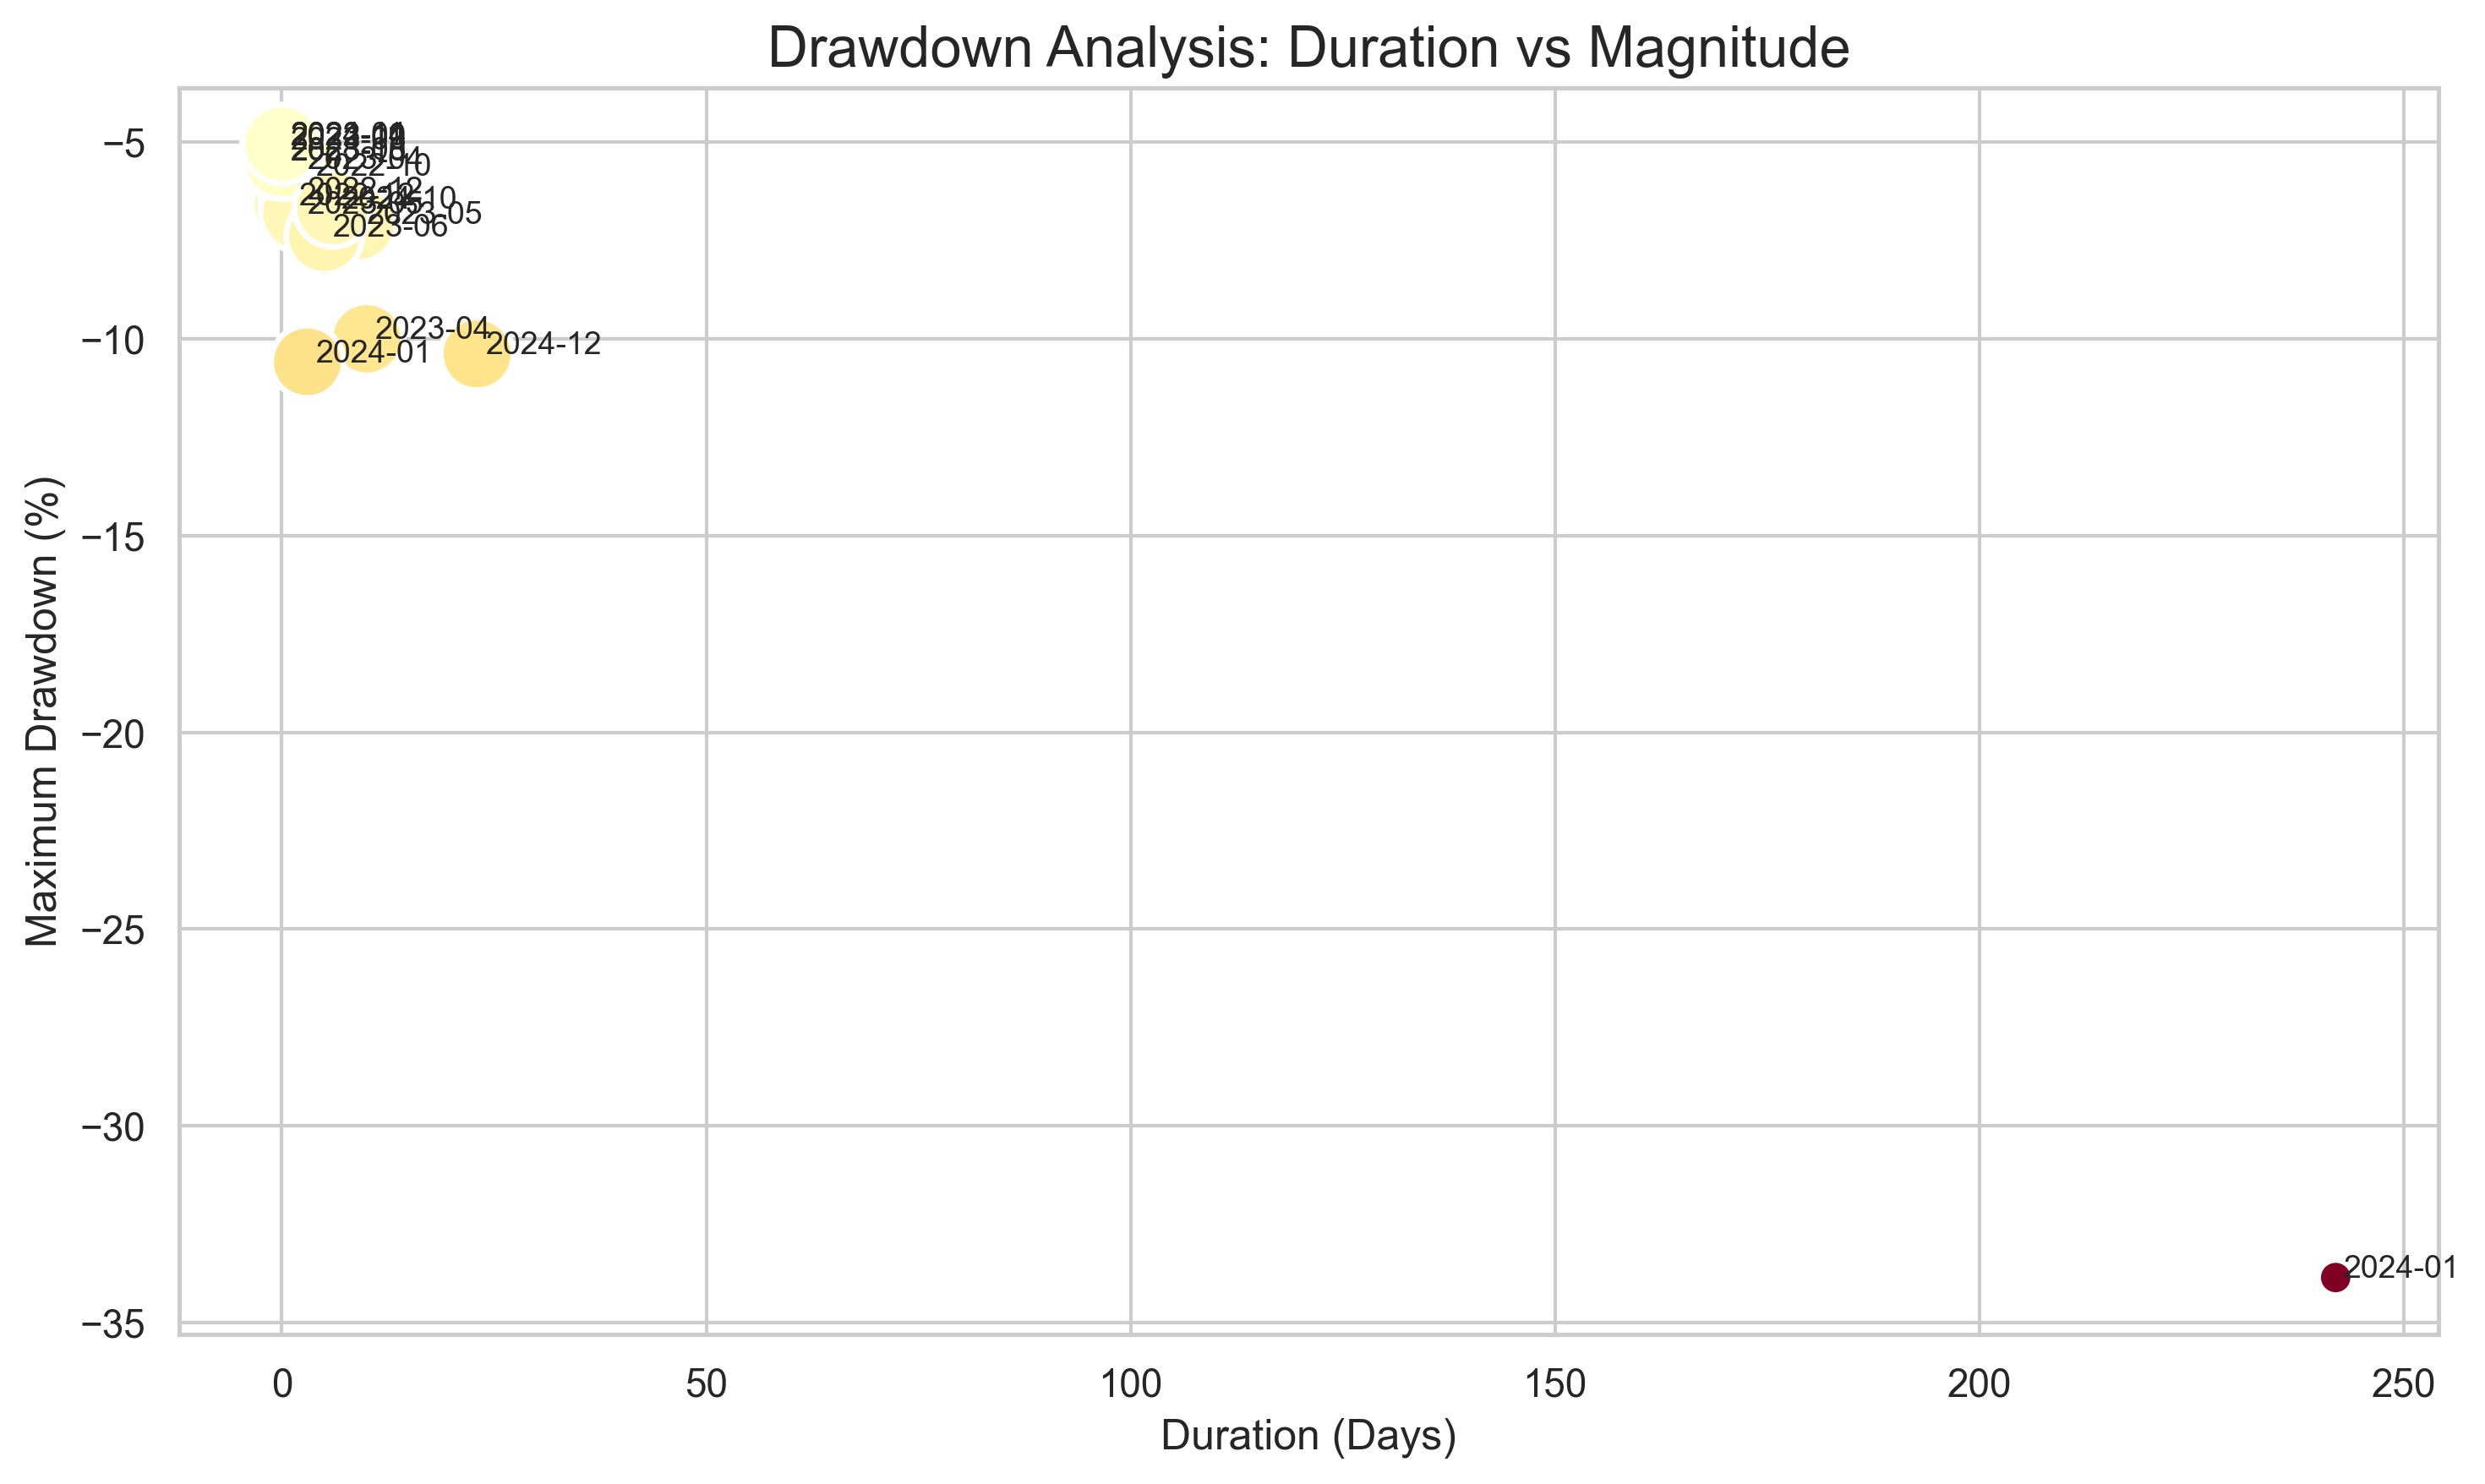
My portfolio has achieved a [223.63]% since inception, with an annualized return of [45.17]%. The maximum drawdown experienced was [33.85]% during [2024].
Key Performance Metrics
| Metric | Value |
|---|---|
| Total Return (%) | [223.63] |
| Annualized Return (%) | [45.17] |
| Annualized Volatility (%) | [23.66] |
| Sharpe Ratio | [1.80] |
| Sortino Ratio | [2.23] |
| Maximum Drawdown (%) | [33.85] |
| Win Rate (%) The percentage of trading days where you made money (positive returns). | [58.44] |
| Average Win (%) The average size of your gains on winning days. | [1.03] |
| Average Loss (%) The average size of your loss on losing days. | [-1.08] |
| Profit Factor For every dollar you lose, you make $1.36 in profits. | [1.36] |
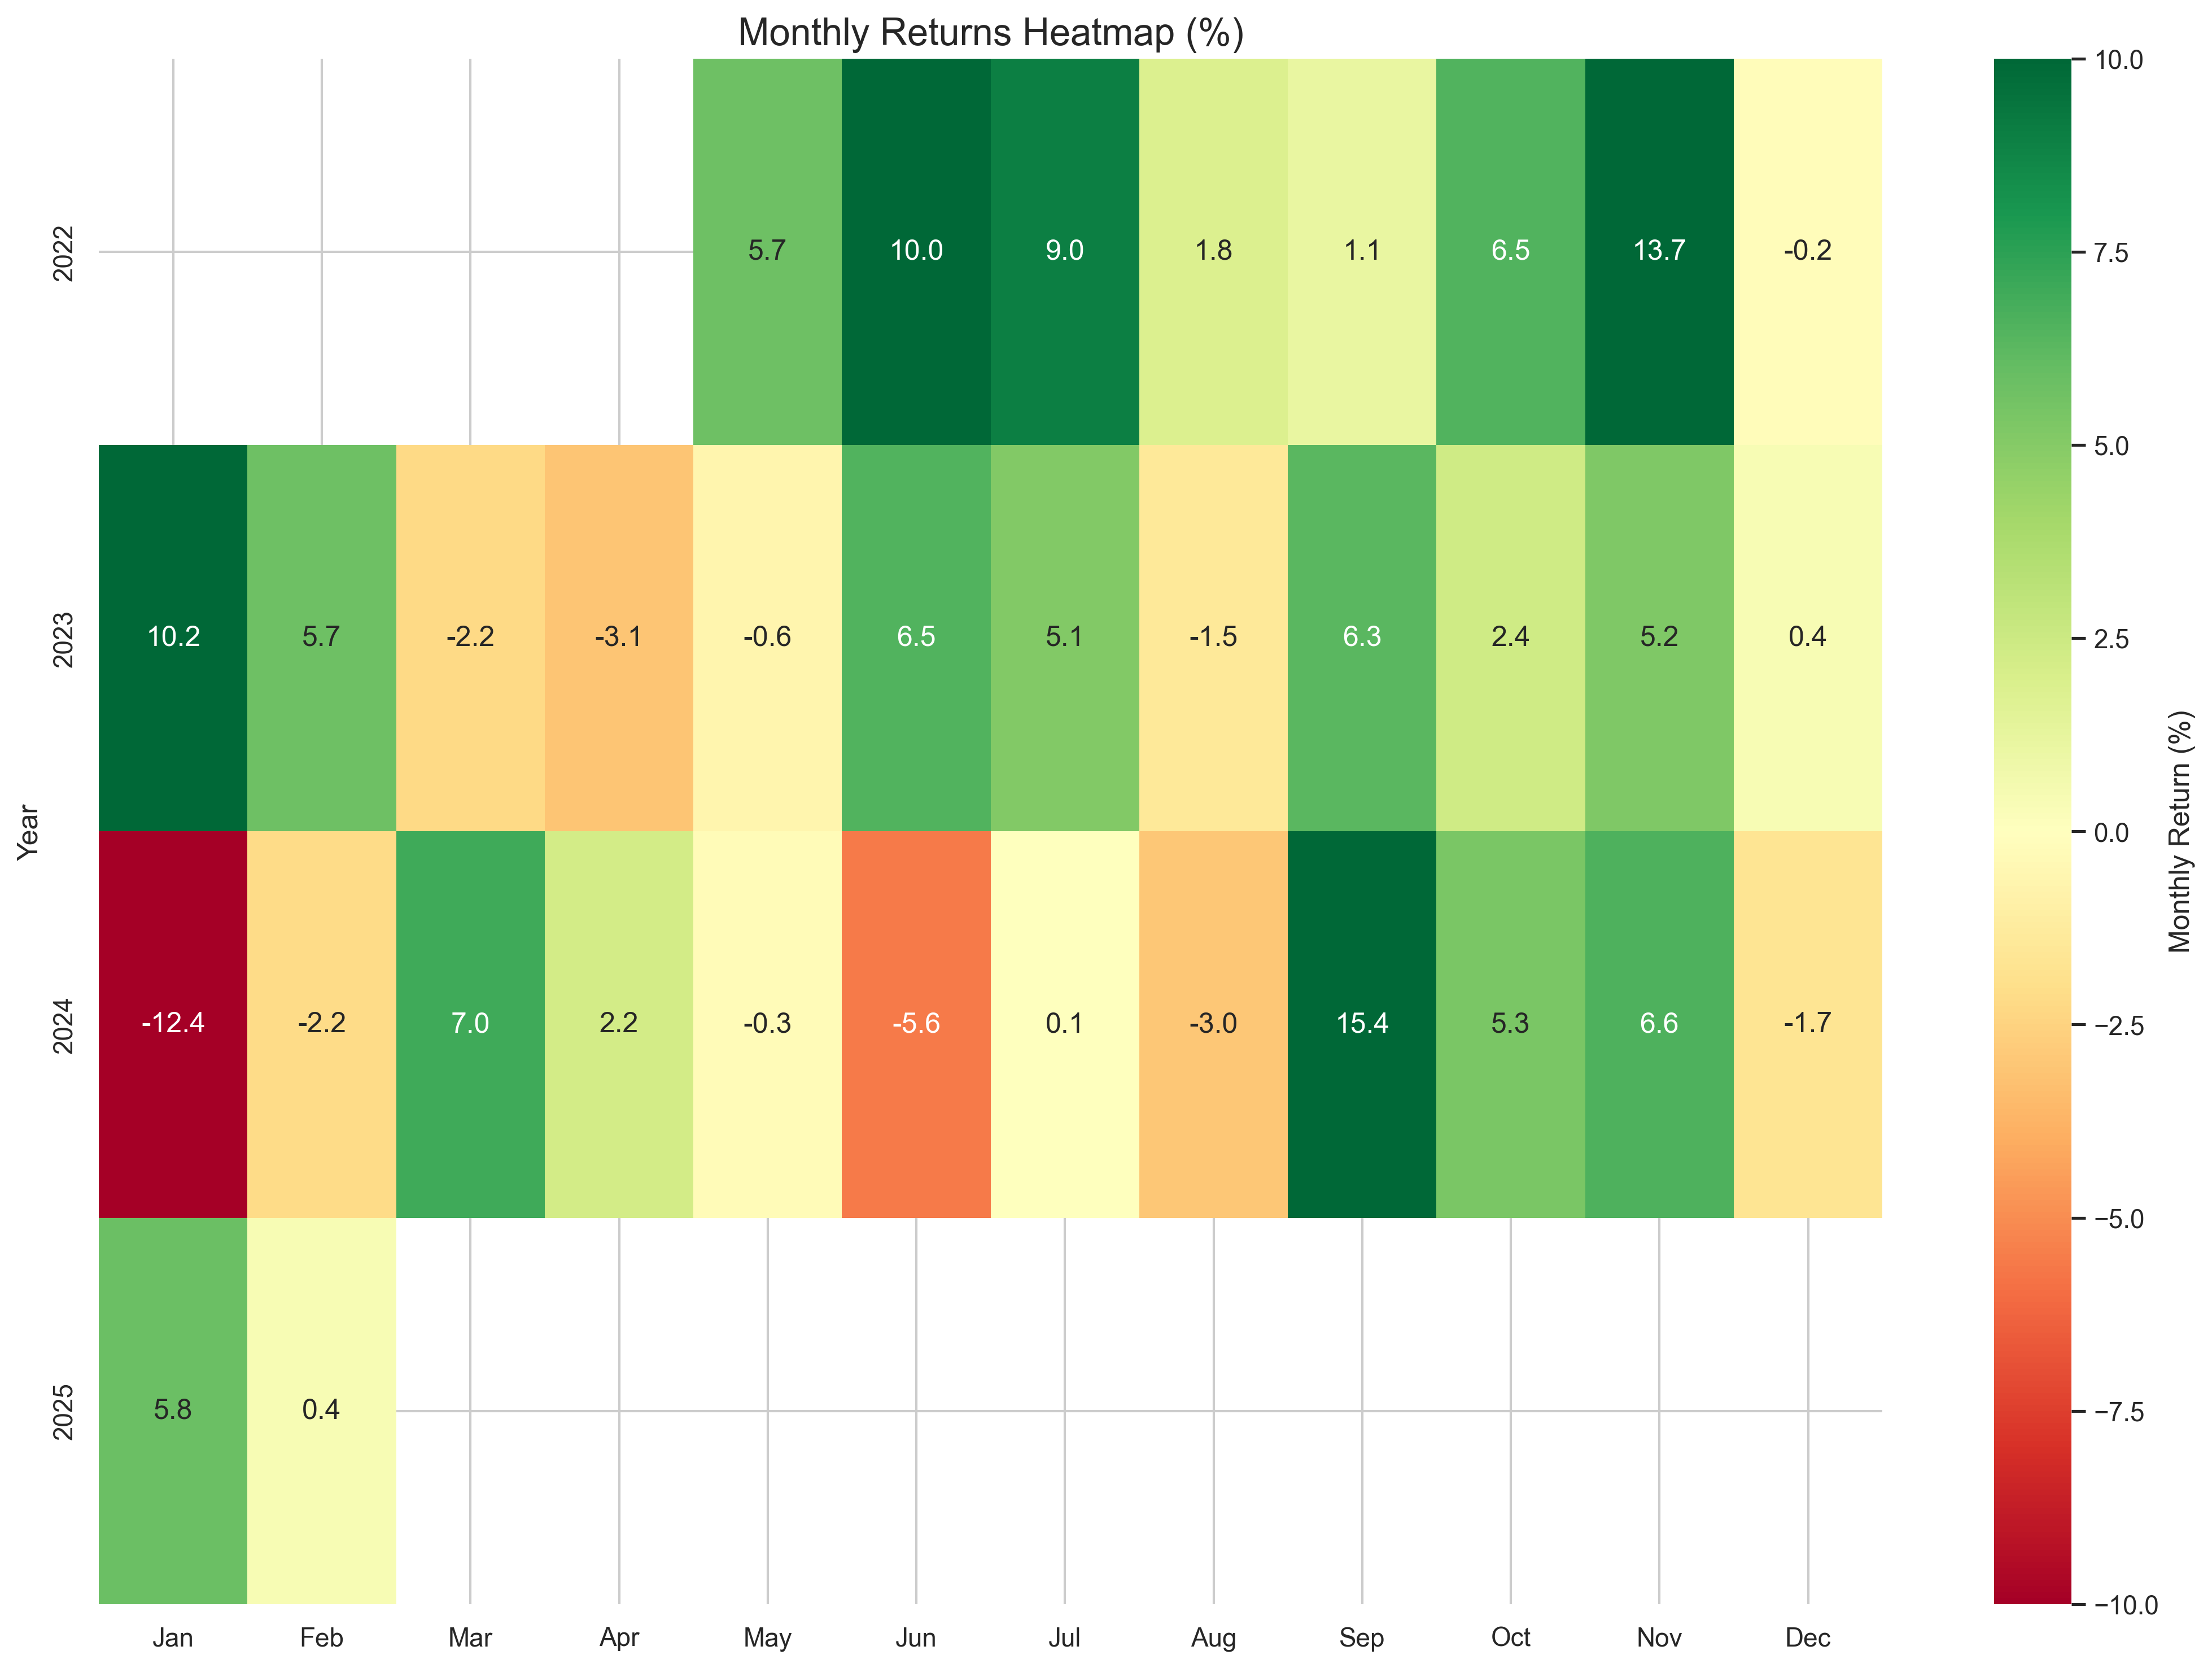
Monthly Performance Heatmap
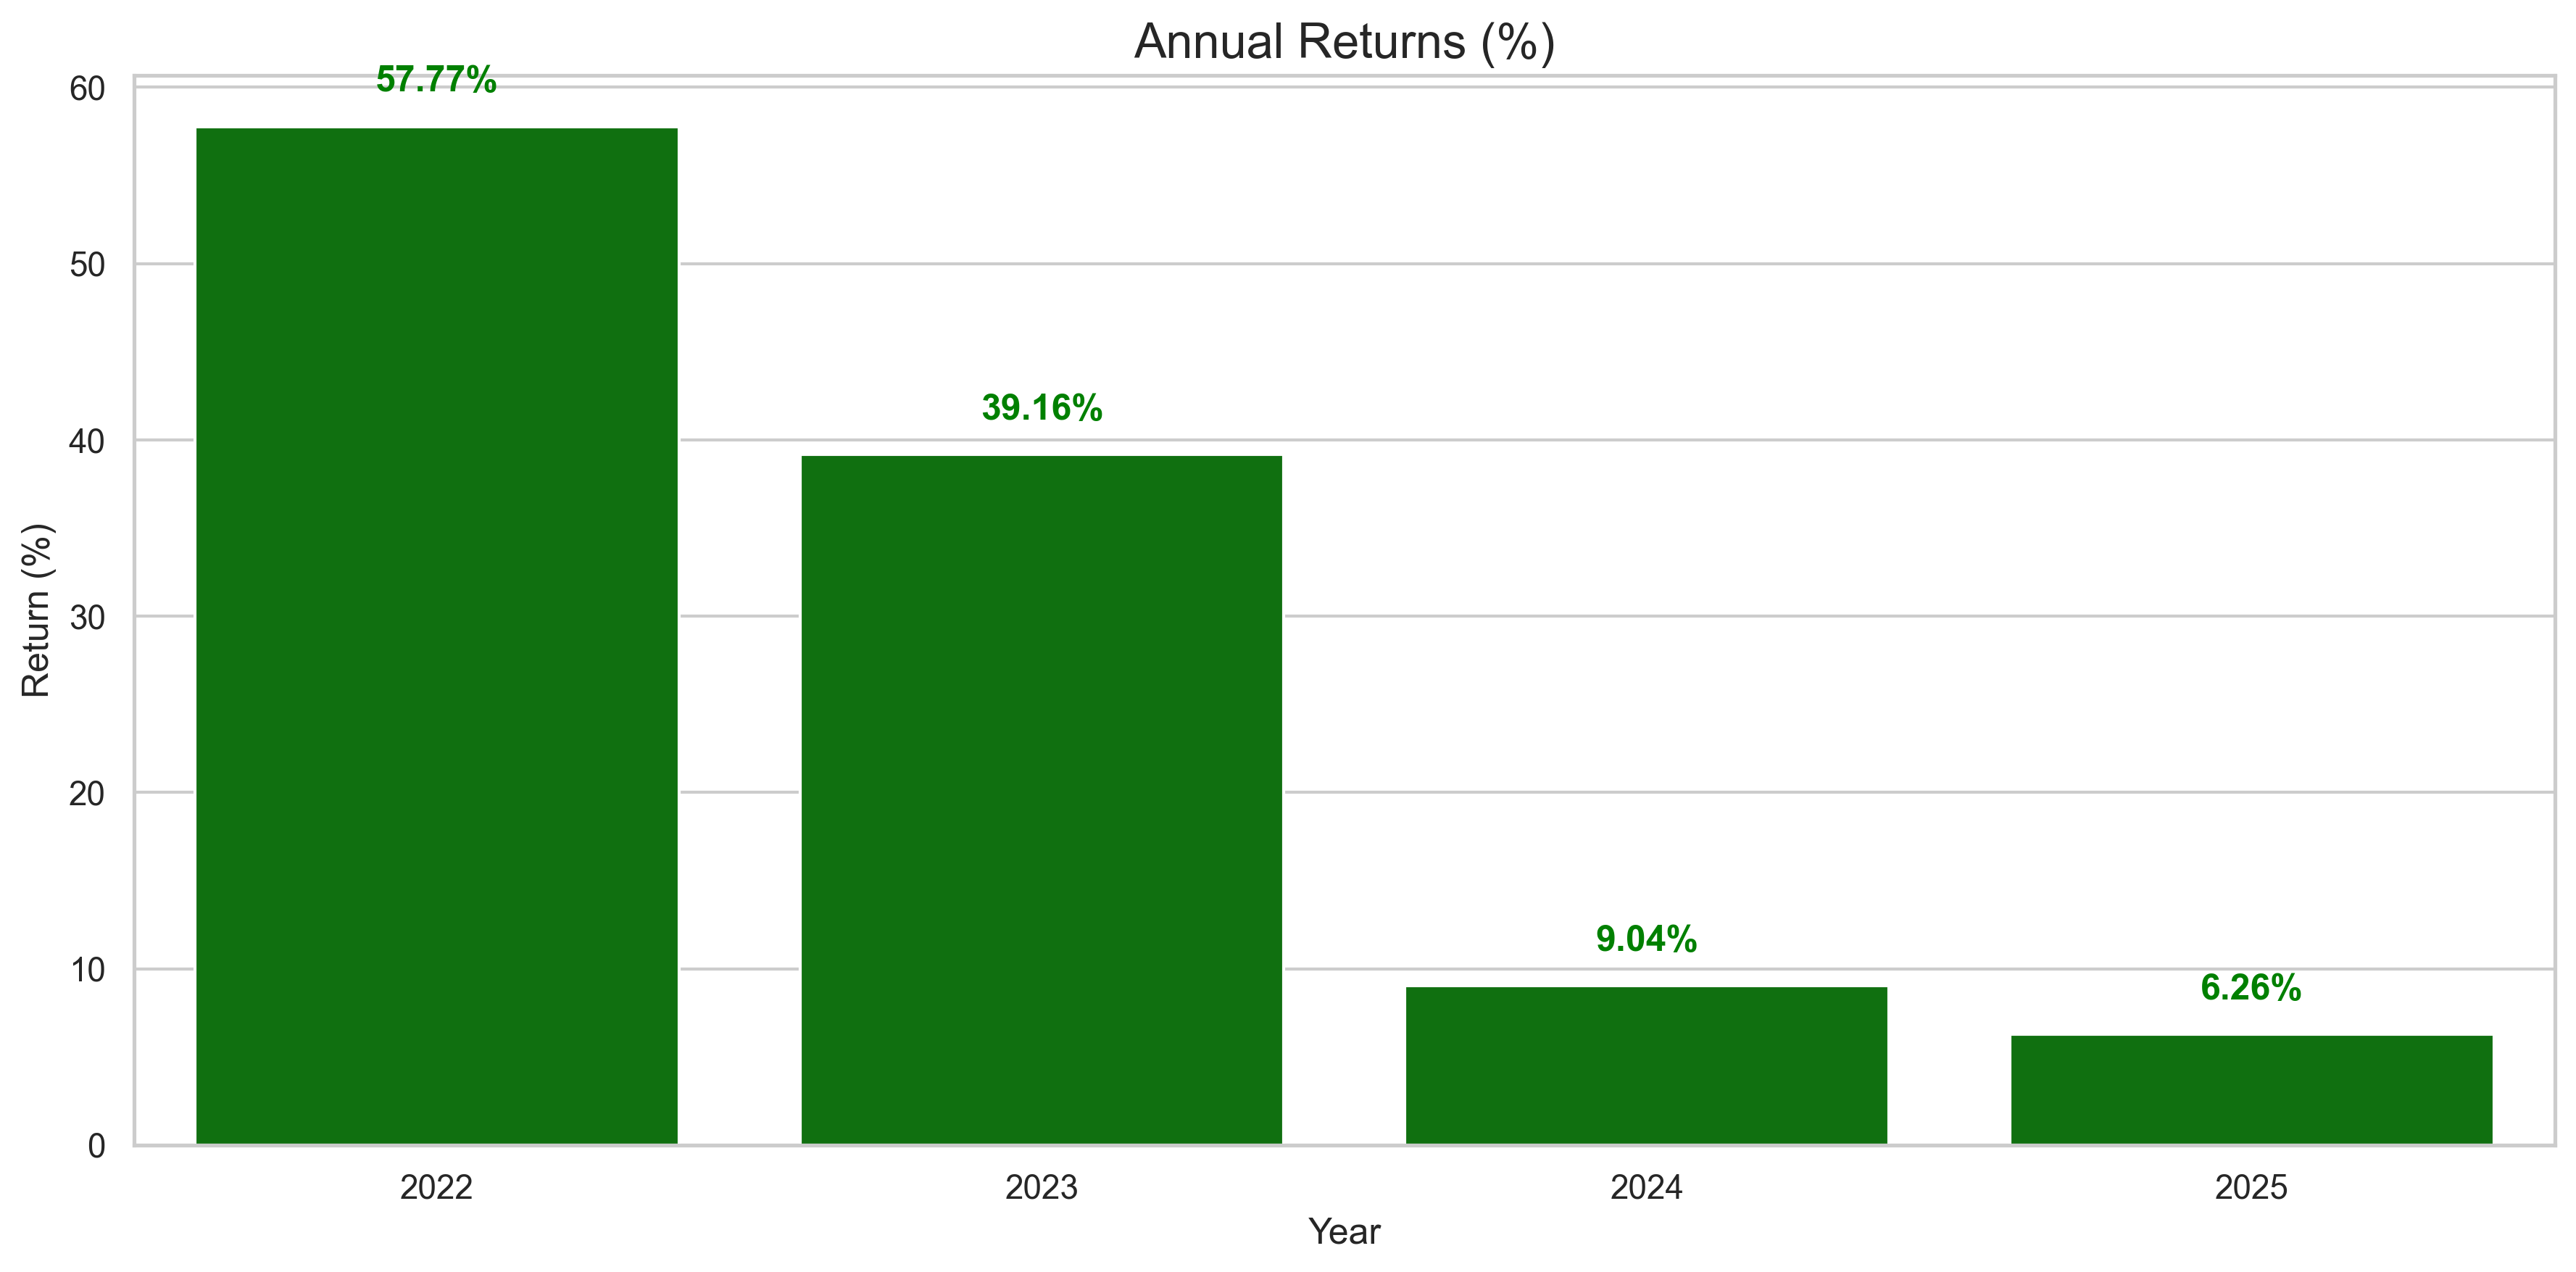
Annual Returns
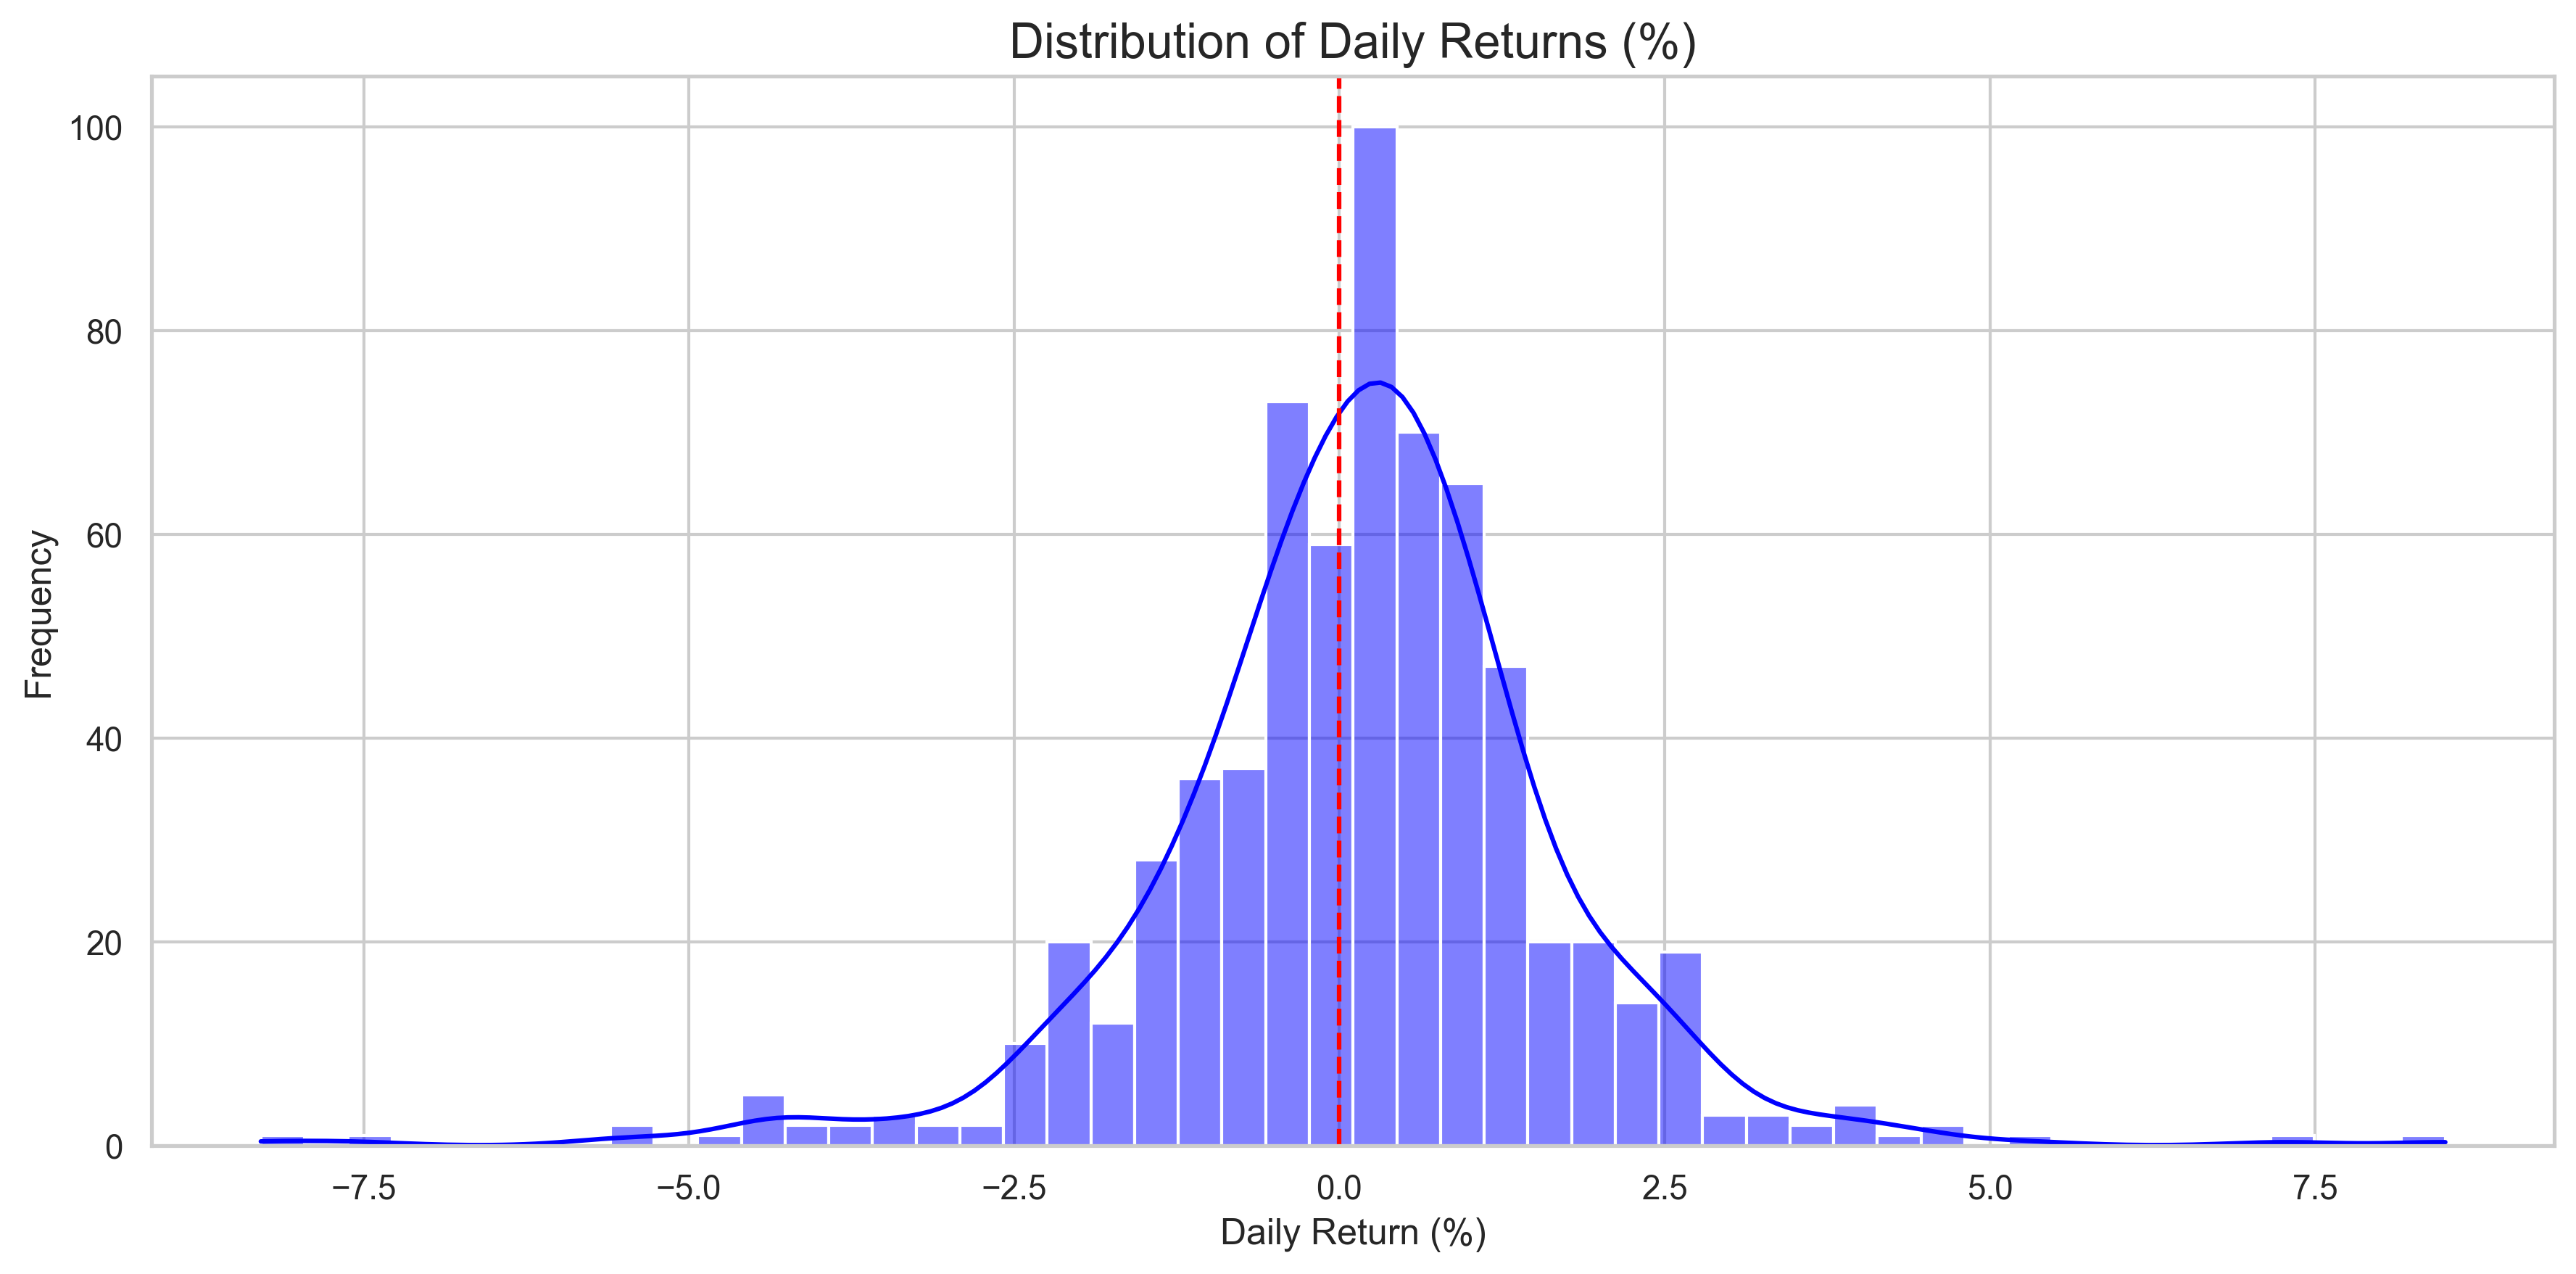
Return Distribution Analysis
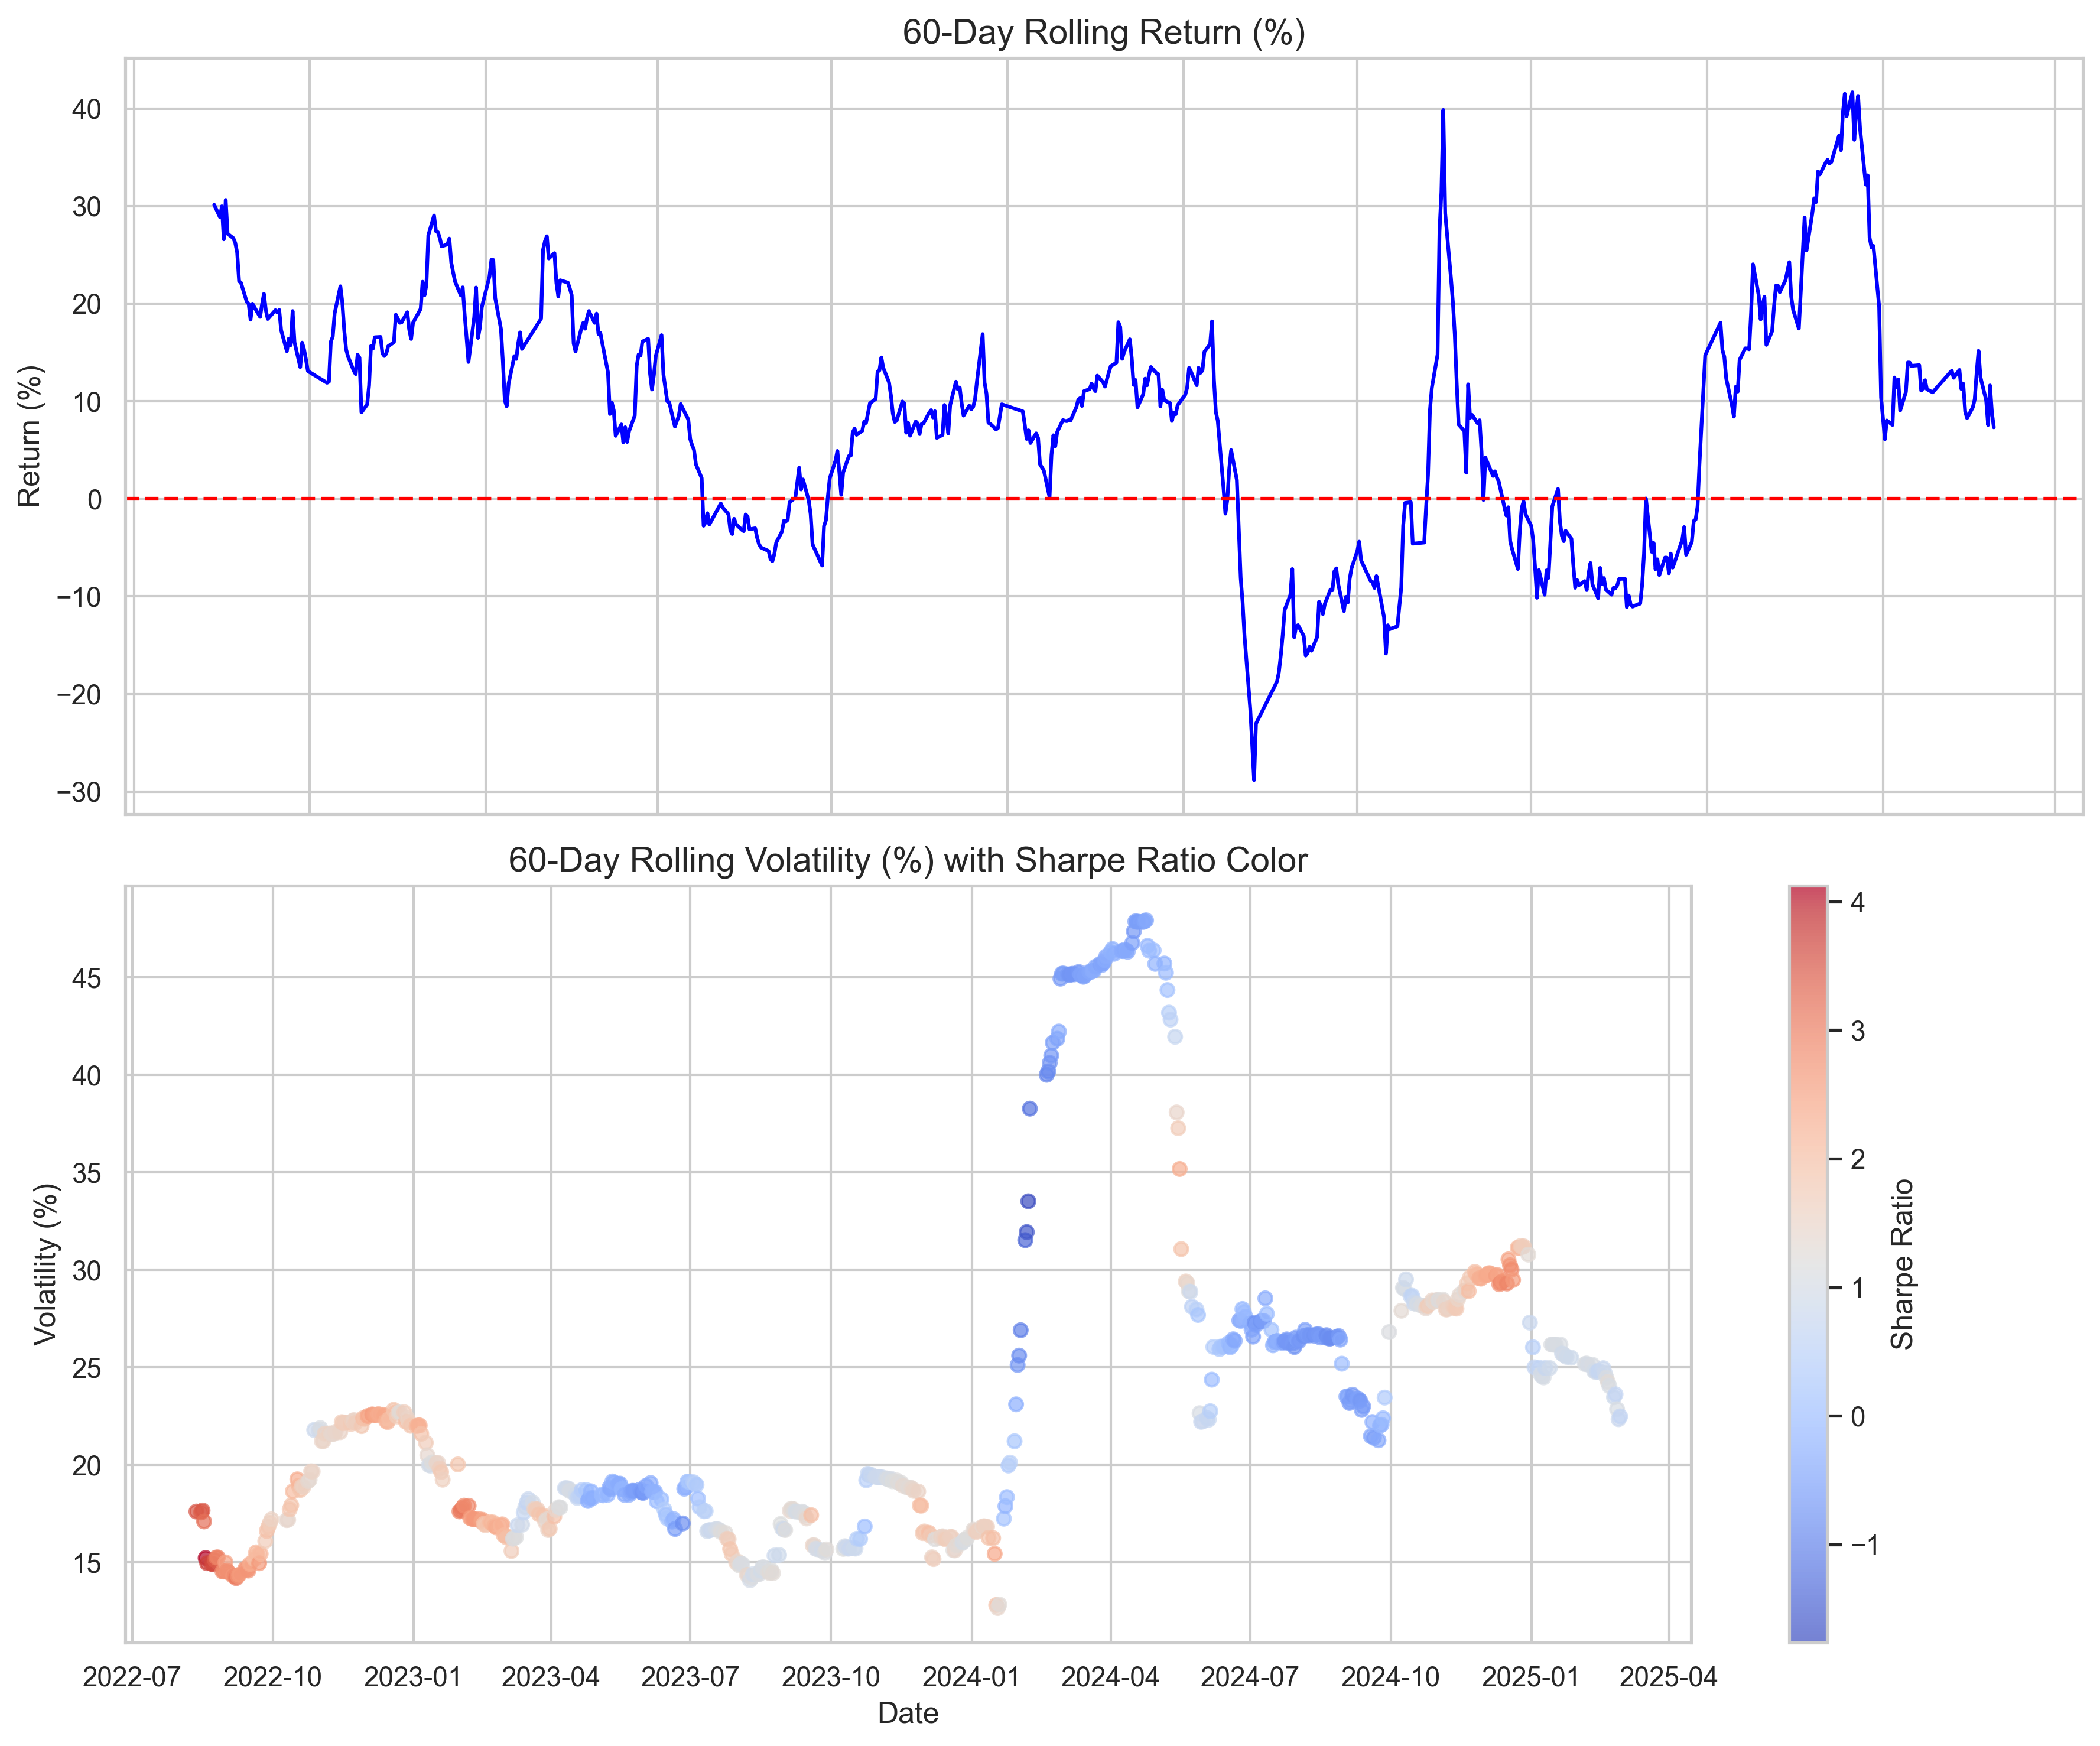
Market Volatility and Rolling Performance
Drawdown Analysis
Monthly Summary of Return
| Time | Return of my portfolio(%) | Return of the Shanghai Stock Index(%) |
|---|---|---|
| May 2022 | 5.73 | 3.26 |
| Jun 2022 | 9.96 | 6.66 |
| Jul 2022 | 9.03 | -4.28 |
| Aug 2022 | 1.81 | -1.57 |
| Sep 2022 | 1.15 | -5.55 |
| Oct 2022 | 6.50 | -4.33 |
| Nov 2022 | 13.68 | 8.91 |
| Dec 2022 | -0.16 | -1.97 |
| Jan 2023 | 10.17 | 5.39 |
| Feb 2023 | 5.75 | 0.74 |
| Mar 2023 | -2.23 | -0.21 |
| Apr 2023 | -3.06 | 1.54 |
| May 2023 | 0.58 | -3.57 |
| Jun 2023 | 6.48 | -0.08 |
| Jul 2023 | 5.14 | 2.78 |
| Aug 2023 | -1.46 | -5.20 |
| Sep 2023 | 6.26 | -0.30 |
| Oct 2023 | 2.38 | -2.95 |
| Nov 2023 | 5.23 | 0.36 |
| Dec 2023 | 0.43 | -1.81 |
| Jan 2024 | -12.42 | -6.27 |
| Feb 2024 | -2.16 | +8.13 |
| Mar 2024 | +7.01 | +0.86 |
| Apr 2024 | +2.19 | +2.09 |
| May 2024 | -0.31 | -0.58 |
| Jun 2024 | -5.58 | -3.87 |
| Jul 2024 | 0.07 | -0.97 |
| Aug 2024 | -3.04 | -3.29 |
| Sep 2024 | 15.41 | 17.39 |
| Oct 2024 | 5.51 | -1.70 |
| Nov 2024 | 6.57 | 1.42 |
| Dec 2024 | -1.67 | 0.76 |
| Jan 2025 | 5.84 | -3.02 |
| Feb 2025 | 0.4 | 2.16 |
| Mar 2025 | 3.52 | 0.45 |
| Apr 2025 | 2.75 | -1.70 |
| May 2025 | 6.64 | 2.09 |
| Jun 2025 | 6.46 | 2.90 |
| Jul 2025 | 3.87 | 3.74 |
| Aug 2025 | 1.42 | 7.97 |
|=============================|