
Quantitative Stock Selection Strategy 101(1): Basic Framework
Published:
In this article, I shall introduce the structure of an effective strategy for stock selection. Upon completion, readers will gain insights into its essence.
Step 1: Acquisition of Data
In the realm of quantitative investment, the cornerstone of productivity is the acquisition of high-caliber data. The absence of such data renders even the most profound insights futile. In the United States, stock data acquisition can be prohibitively expensive, with platforms such as Yahoo Finance typically offering only daily price and volume information. This level of data is inadequate for thorough analysis, which necessitates comprehensive financial statement data, including balance sheets, income statements, and cash flow statements.
Fortunately, the Chinese stock market offers a more economical alternative for obtaining daily data, encompassing price, volume, and detailed financial statements. This accessibility significantly enhances the feasibility of our investment strategies.
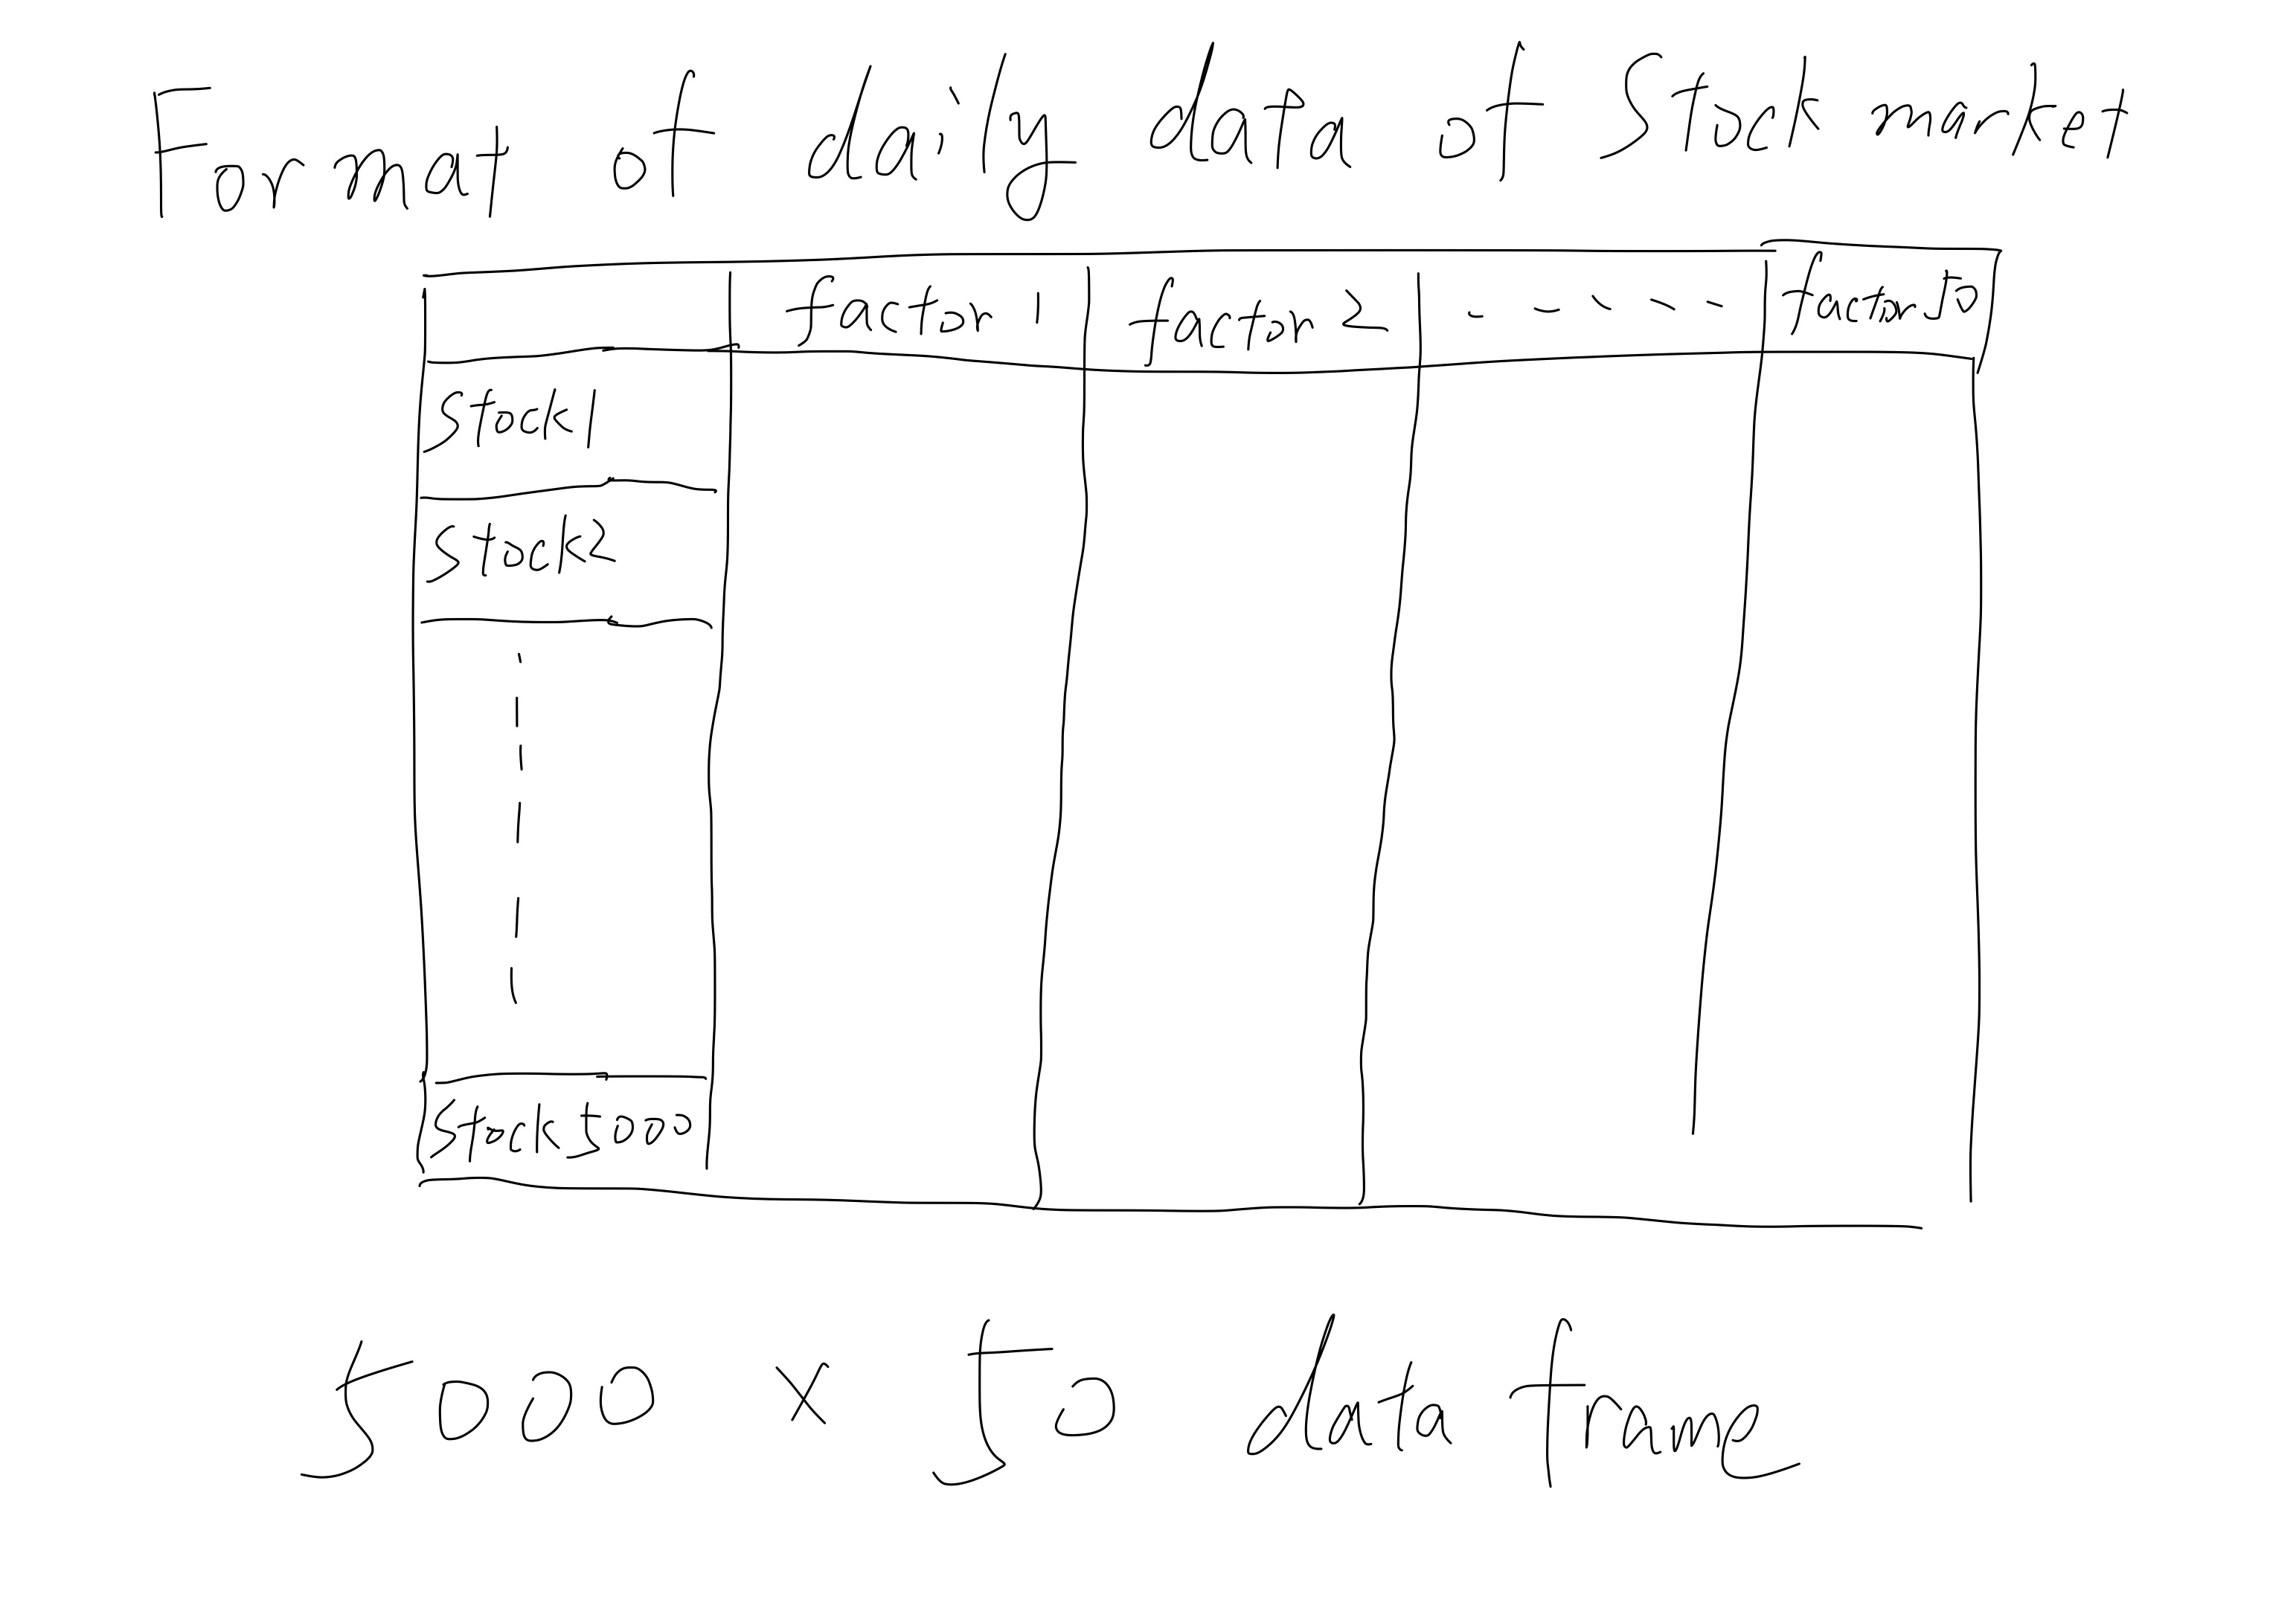
The data we utilize is structured in a data frame format, with dimensions of 5000 by 50, extracted from a database. Within this matrix, each row corresponds to an individual stock, while each column denotes a specific factor. These factors, which include Return on Equity (ROE), revenue growth rate, 5-day average price, market capitalization, and debt-to-asset ratio, can be readily derived or computed through sophisticated machine-learning techniques. Regardless of the data source, our analytical process invariably commences with such a data frame, setting the stage for the subsequent stages of our strategy.
Step 2: Calculate the Scores
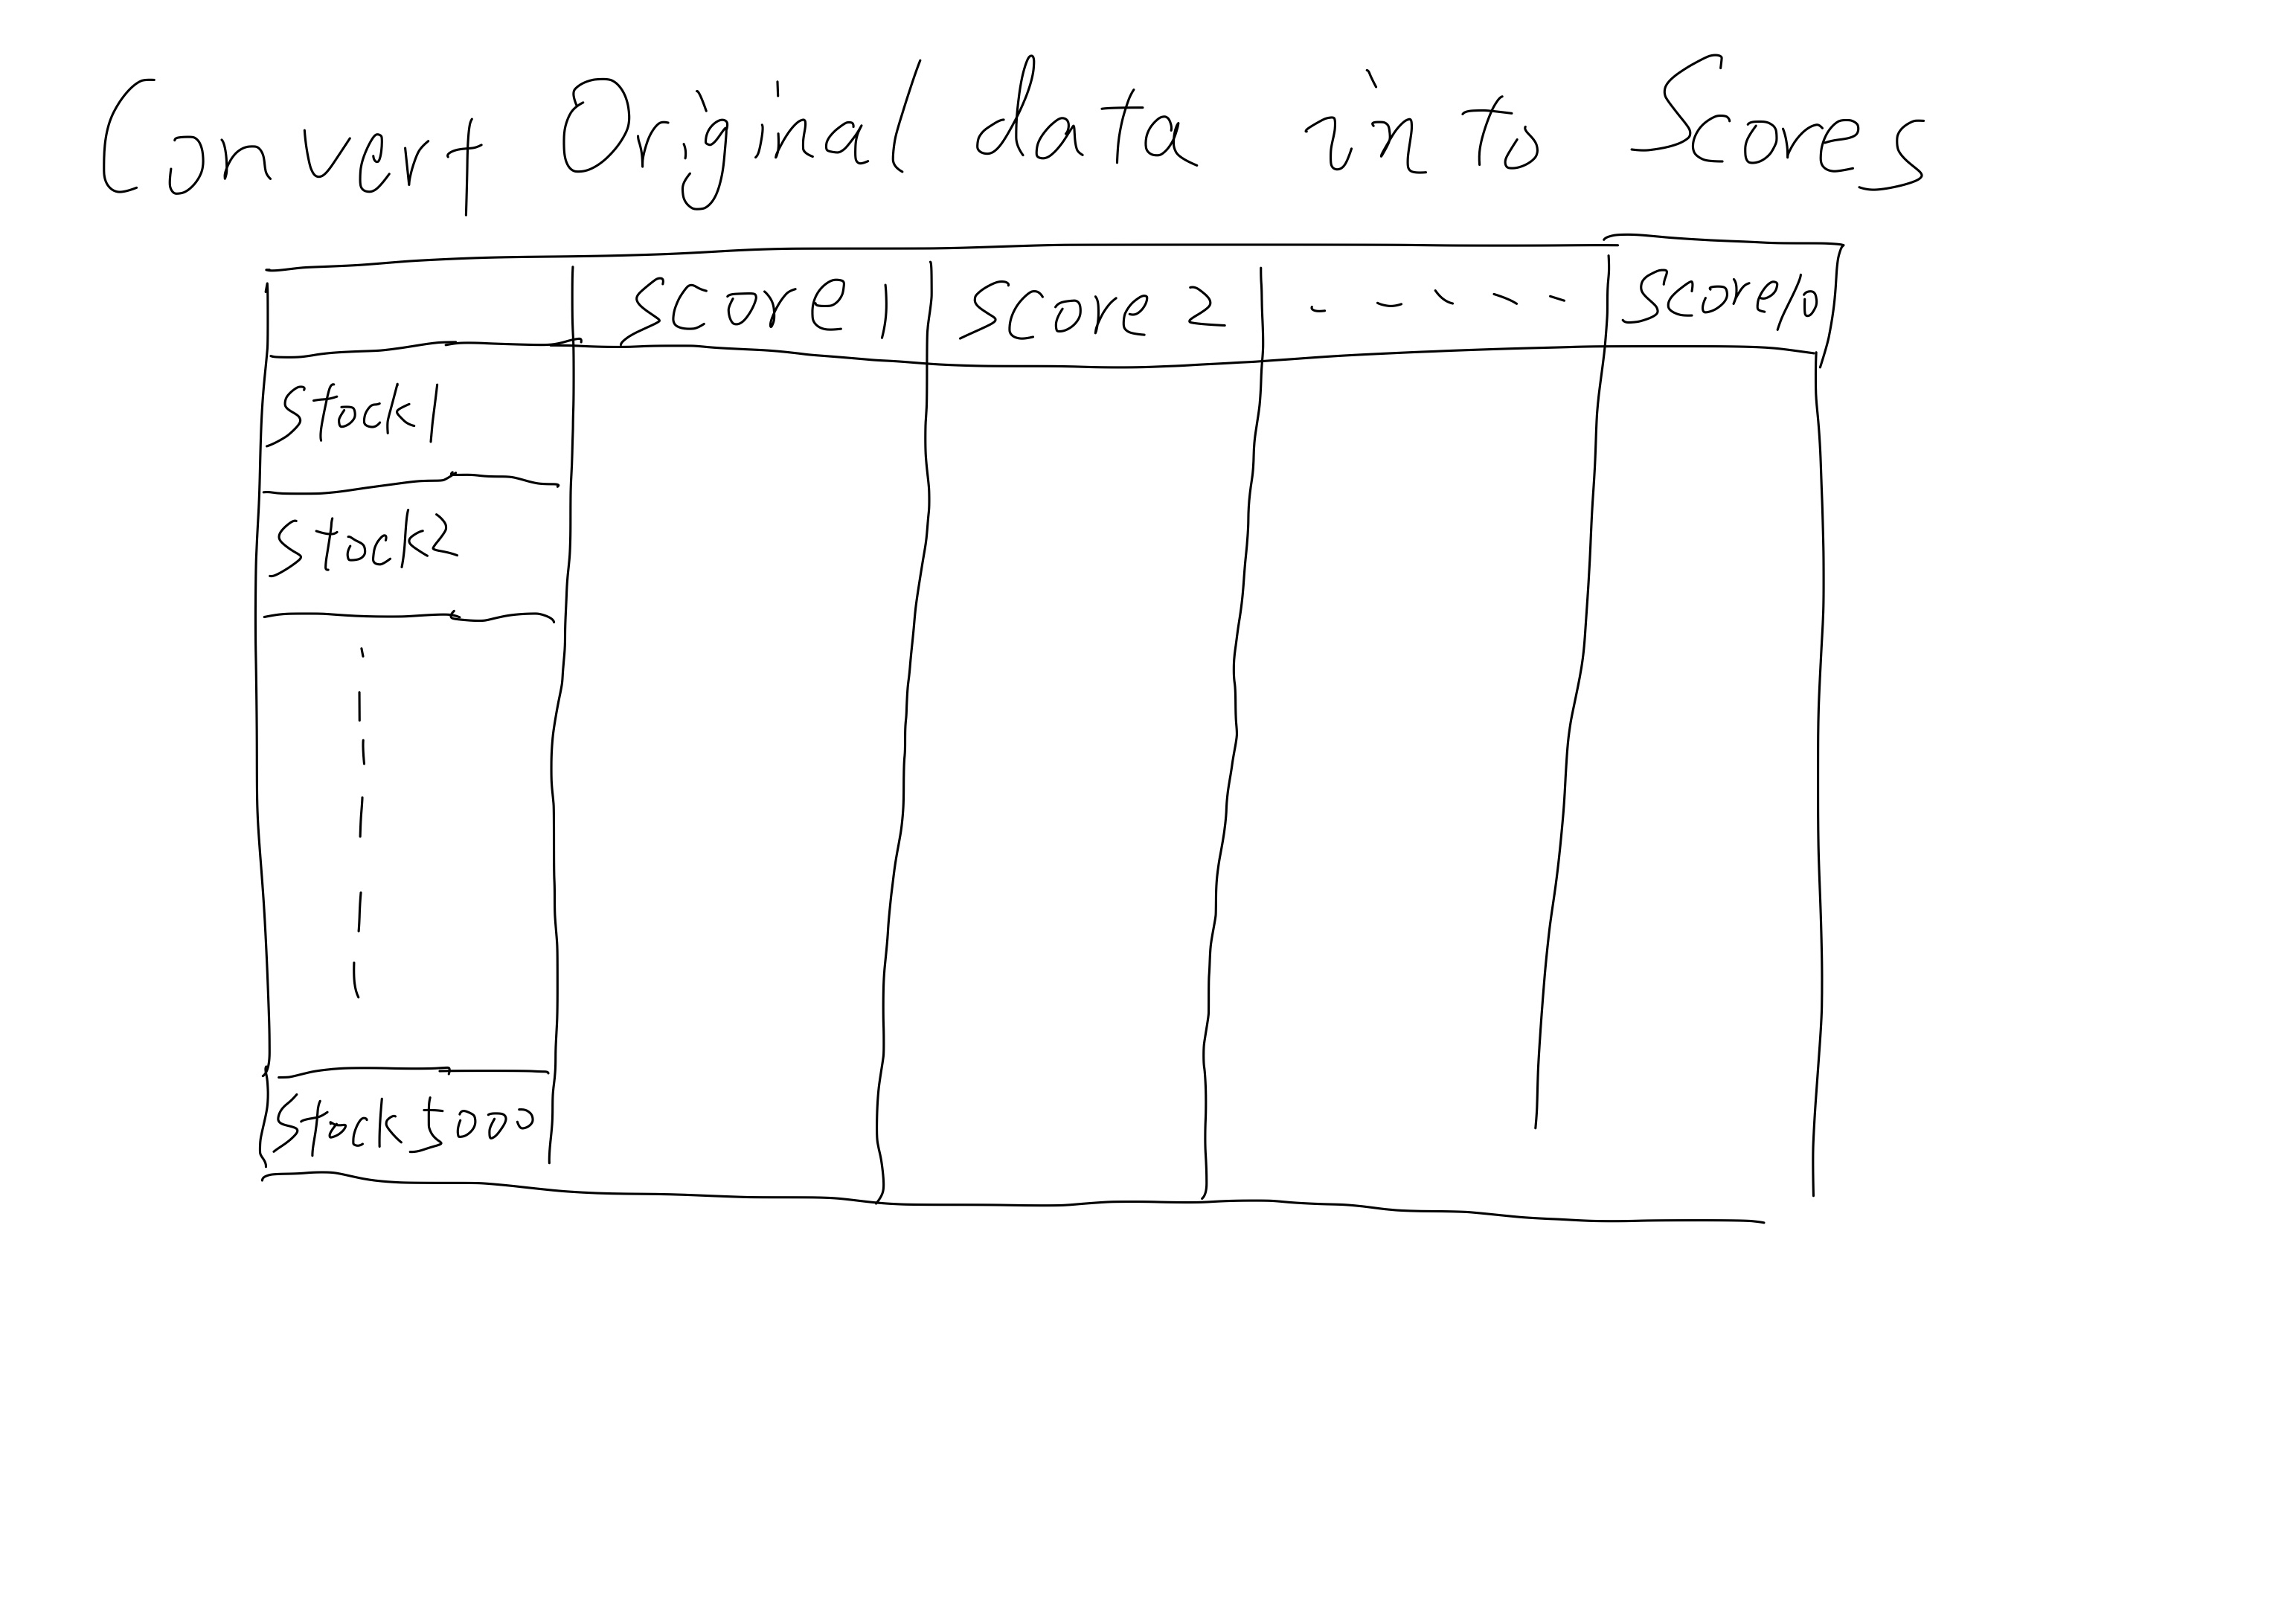
The essence of our stock selection strategy lies in identifying profitable stocks. The crux of this process involves utilizing raw financial metrics to formulate composite scores for each stock. The underlying principle is that stocks with higher scores are deemed to be of superior quality. Thus, our investment focus should be on these high-scoring stocks, while those with lower scores are considered less desirable.
To illustrate the method of score synthesis, consider an example involving three stocks and three financial metrics: Return on Equity (ROE), the inverse of the price-to-book (P/B) ratio, and the Revenue Growth Rate. The data for these metrics is as follows:
| Stock | ROE | 1/pb ratio | Revenue Growth Rate |
|---|---|---|---|
| A | 15% | 0.02 | 7% |
| B | 12% | 0.15 | 50% |
| C | 8% | 0.1 | -10% |
Based on the common sence, for each metric, a higher value correlates with a higher stock quality. We achieve uniformity in measurement across disparate metrics by ranking them. This ranking process allows us to standardize the evaluation of each factor, regardless of its inherent scale or unit.
By aggregating these ranks, we derive a comprehensive score for each stock, offering a holistic assessment of its potential. Here is the way about generating the scores.
| Stock | Rank.ROE | Rank.1/pb ratio | Rank.Revenue Growth Rate | Score |
|---|---|---|---|---|
| A | 3 | 2 | 2 | 7=3+2+2 |
| B | 2 | 3 | 3 | 8=2+3+3 |
| C | 1 | 1 | 1 | 3=1+1+1 |
The score indicates that B>A>C. Utilizing the multiple factors, we can convert the original data frame into a data frame of scores.
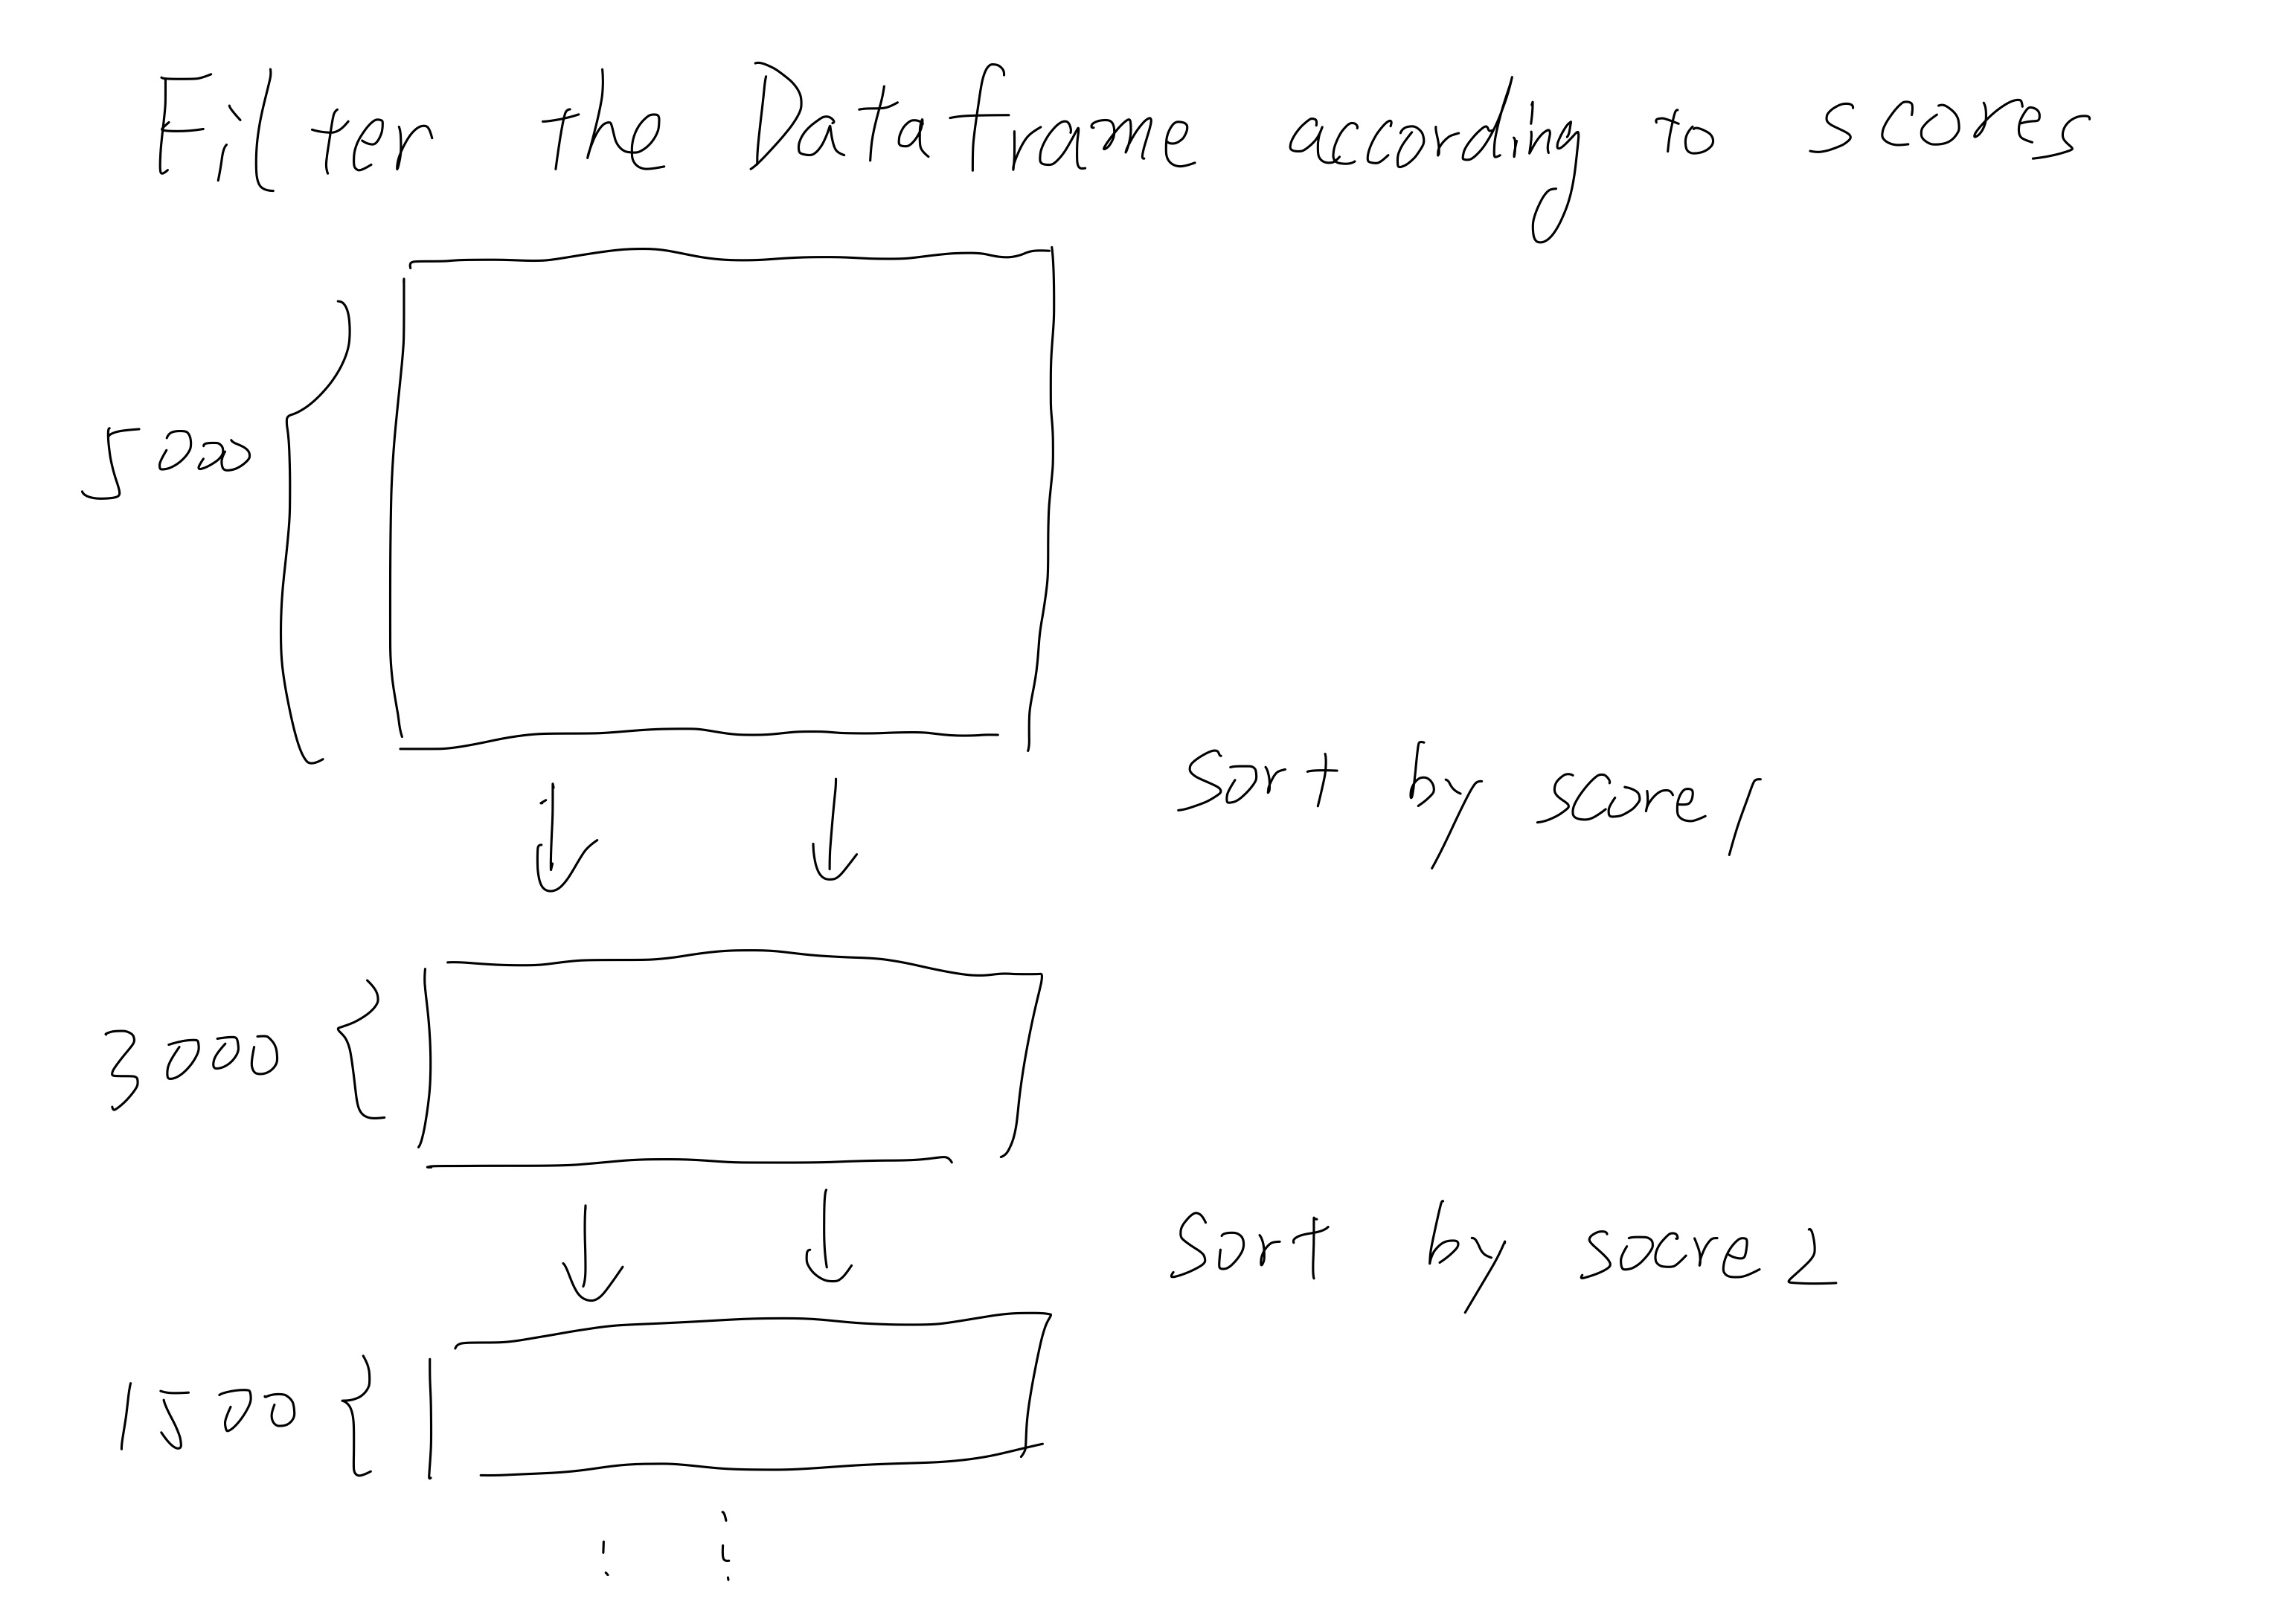
Step 3: Filtering the Data Frame
The scores gives us the criteria to filter the data frame and obtain the profitable stocks. By implementing a layered filtering process, we graduately truncate the dataset. This approach ends with a concise list of stocks, typically encompassing ten top candidates. These selected stocks represent the our investment targets.
Step 4: Rebalacing the portfolio
Each day, prior to the opening of the market, the aforementioned process is repeated. Chances are that we would obtain a different list of candidates of stocks compared to our existing portfolios. We need to rebalance our portfolio to handle this difference, which can be easily illustrated in the following picture.
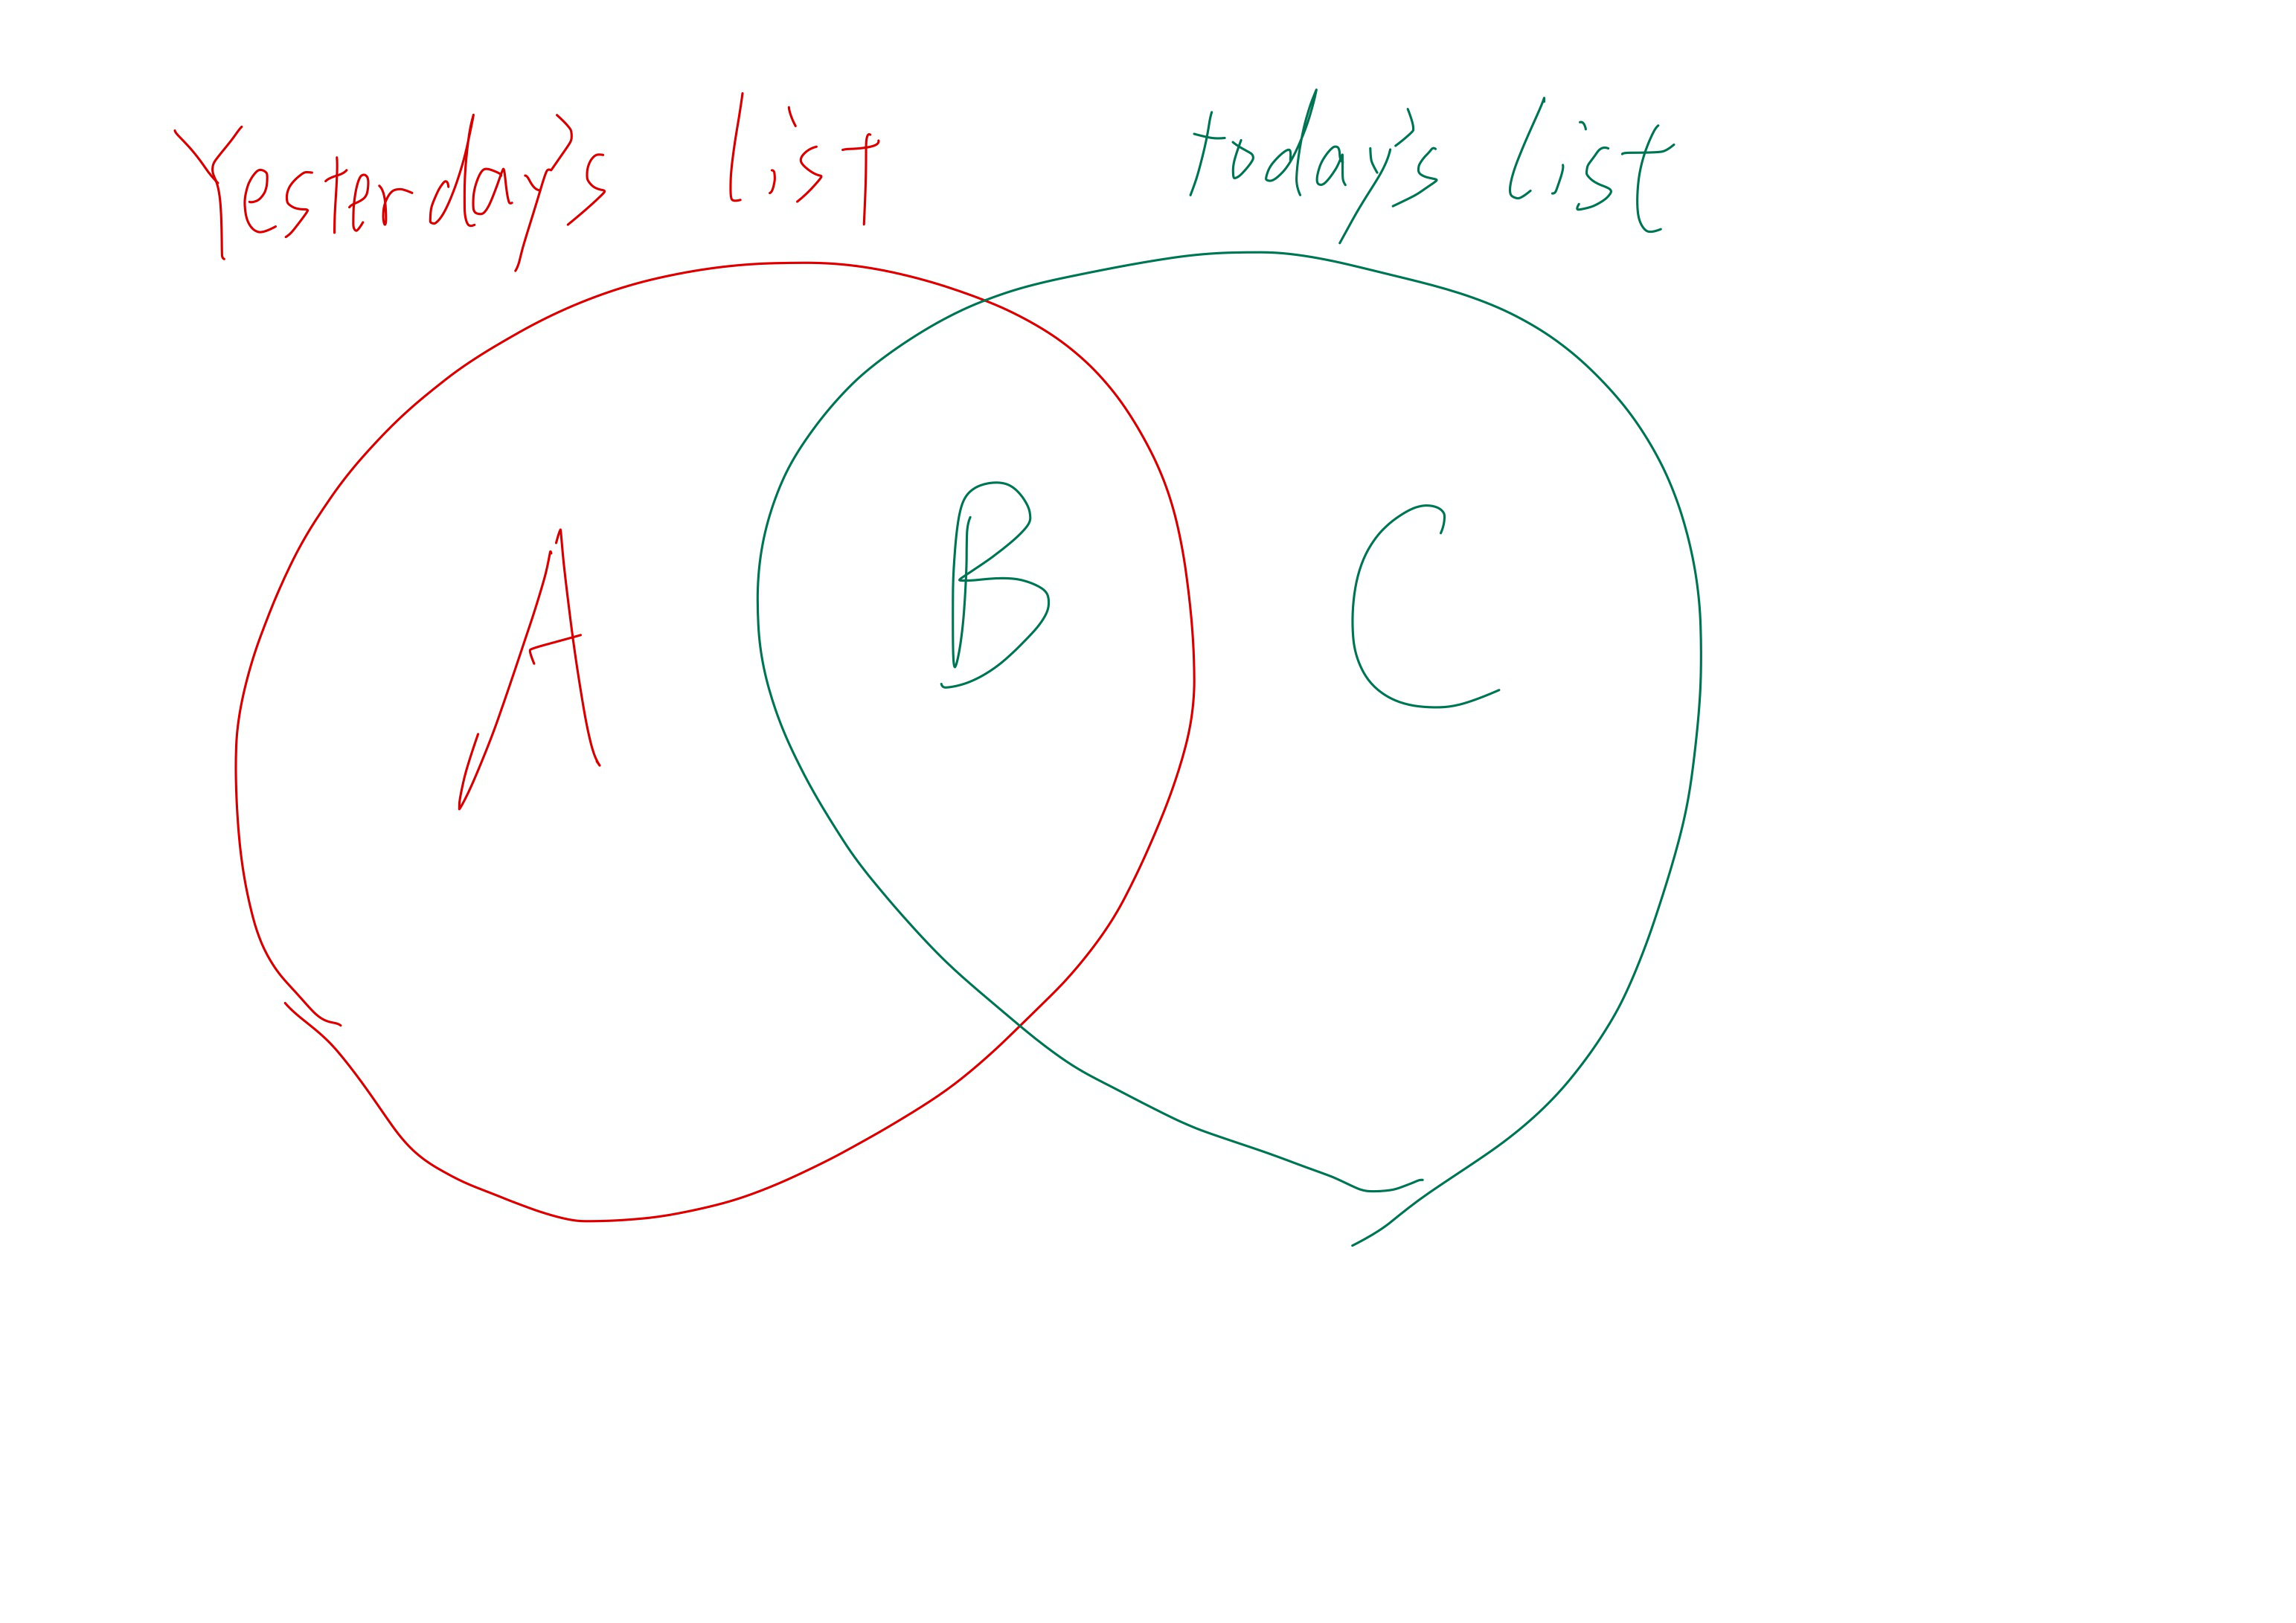
For stocks in Region A, given their inclusion in the previous day’s list, we currently maintain a position in these assets. However, their absence from today’s list indicates that we should sell them when the market opens. Conversely, stocks falling into Region C represent new candidates, not held in our portfolio due to their exclusion from yesterday’s list. The capital derived from liquidating positions in Region A will be reallocated towards acquiring shares of these newly identified stocks. Stocks categorized within Region B require no action, as their continued presence on the list signals our ongoing investment.
Regarding the distribution of investment capital across selected stocks, a straightforward and equitable approach is employed. Specifically, for a curated list comprising ten stocks, we allocate an equal portion of our investment capital to each, dedicating 10% of our total funds to every stock in the list.
What to expect next?
Here we just present a frame work, but why would we choose a specific factor is not explained and next time I would illustrate how to evaluate a factor.