
Quantitative Stock Selection Strategy 101(2): Factors Evaluation
Published:
In this article, I shall introduce the evaluation of factors in the stock selection strategy.
Information Coefficient:
The IC (Information Coefficient) value of a factor refers to the correlation coefficient between the factor’s exposure vector in period T and the stock return vector in period T+1, denoted as:
\[IC_T = corr(r_{T+1}, X_T )\]In the formula, the factor exposure vector \(X_T\) typically does not directly use the original factor values but is processed through methods like de-extreming and neutralization. In practical calculations, the Pearson correlation coefficient might be significantly affected by extreme values of the factor, making the Spearman rank correlation coefficient a more robust alternative. The IC calculated this way is generally referred to as Rank IC.
When examining a factor, we can calculate and compute the average of the IC in different time.
\[\sum_{t=T-n}^{T-1}IC_t\]Typically, \(n\) can be 10 or 20.
When evaluating a factor’s performance, it’s important to look at the average IC or Rank IC because these figures give us an idea of how well a factor can predict future returns. A high Rank IC value means the factor is a strong predictor and would be a key consideration in our models. However, it’s also important not to overlook factors with decent, though not top-ranking, IC values. Financial data is extremely valuable, and we should aim to use it as effectively as possible.
The IC is like a focused measure of predictability, similar to a point estimator in statistics. But just like in statistics, where we use more than one estimator to get a full picture, we need to look beyond just the IC to fully understand a factor’s performance. The next method I’ll talk about is simple, but it helps give us a broader view of how factors perform.
Portfolio Sort:
The Portfolio Sort method is a straightforward yet effective approach for constructing factor-based investment portfolios. This methodology involves three fundamental steps: sorting, grouping, and periodic rebalancing of portfolios based on selected variables.
Sorting: Initially, a comprehensive pool of stocks is established. Subsequently, these stocks are methodically sorted in a cross-sectional manner according to a predefined sorting variable, such as Return on Equity (ROE), arranging them from the highest to the lowest values (or vice versa).
Grouping: Upon completion of the sorting process, the stocks are then segregated into L distinct groups based on their ranking, where L is typically set to 5 or 10. Investment capital is allocated equally across the stocks within these groups.
Periodic Updates: As the variable values of individual stocks change over time (indicating that their exposure to the factor also varies), it’s necessary to periodically perform the two steps mentioned above to update the factor-simulated investment portfolio. This process, often referred to as rebalancing in academia, typically occurs monthly or annually. After constructing a new factor-simulated investment portfolio for each period, calculate its return between the current moment and the next rebalancing point. By repeating this process over time, a time series of the factor’s returns is generated.
Intuitively, an effective factor should exhibit discriminative power, which is to say, it should enable clear differentiation between the returns of various groups. This is often evidenced through the demonstration of monotonicity in returns across sorted groups. For instance, if we categorize the universe of stocks into five groups based on their Return on Equity (ROE) such that ROE1 > ROE2 > ROE3 > ROE4 > ROE5, we would expect the returns to follow a similar order: R1 > R2 > R3 > R4 > R5. In the context of the Chinese stock market, ROE demonstrates such characteristics, making it an exemplary factor.
The principle of monotonicity can be effectively illustrated through a bar plot.
A factor that produces a bar plot displaying this pattern of returns is likely to possess a high Rank IC value. However, as previously noted, factors not achieving the highest Rank IC values can still offer substantial utility.
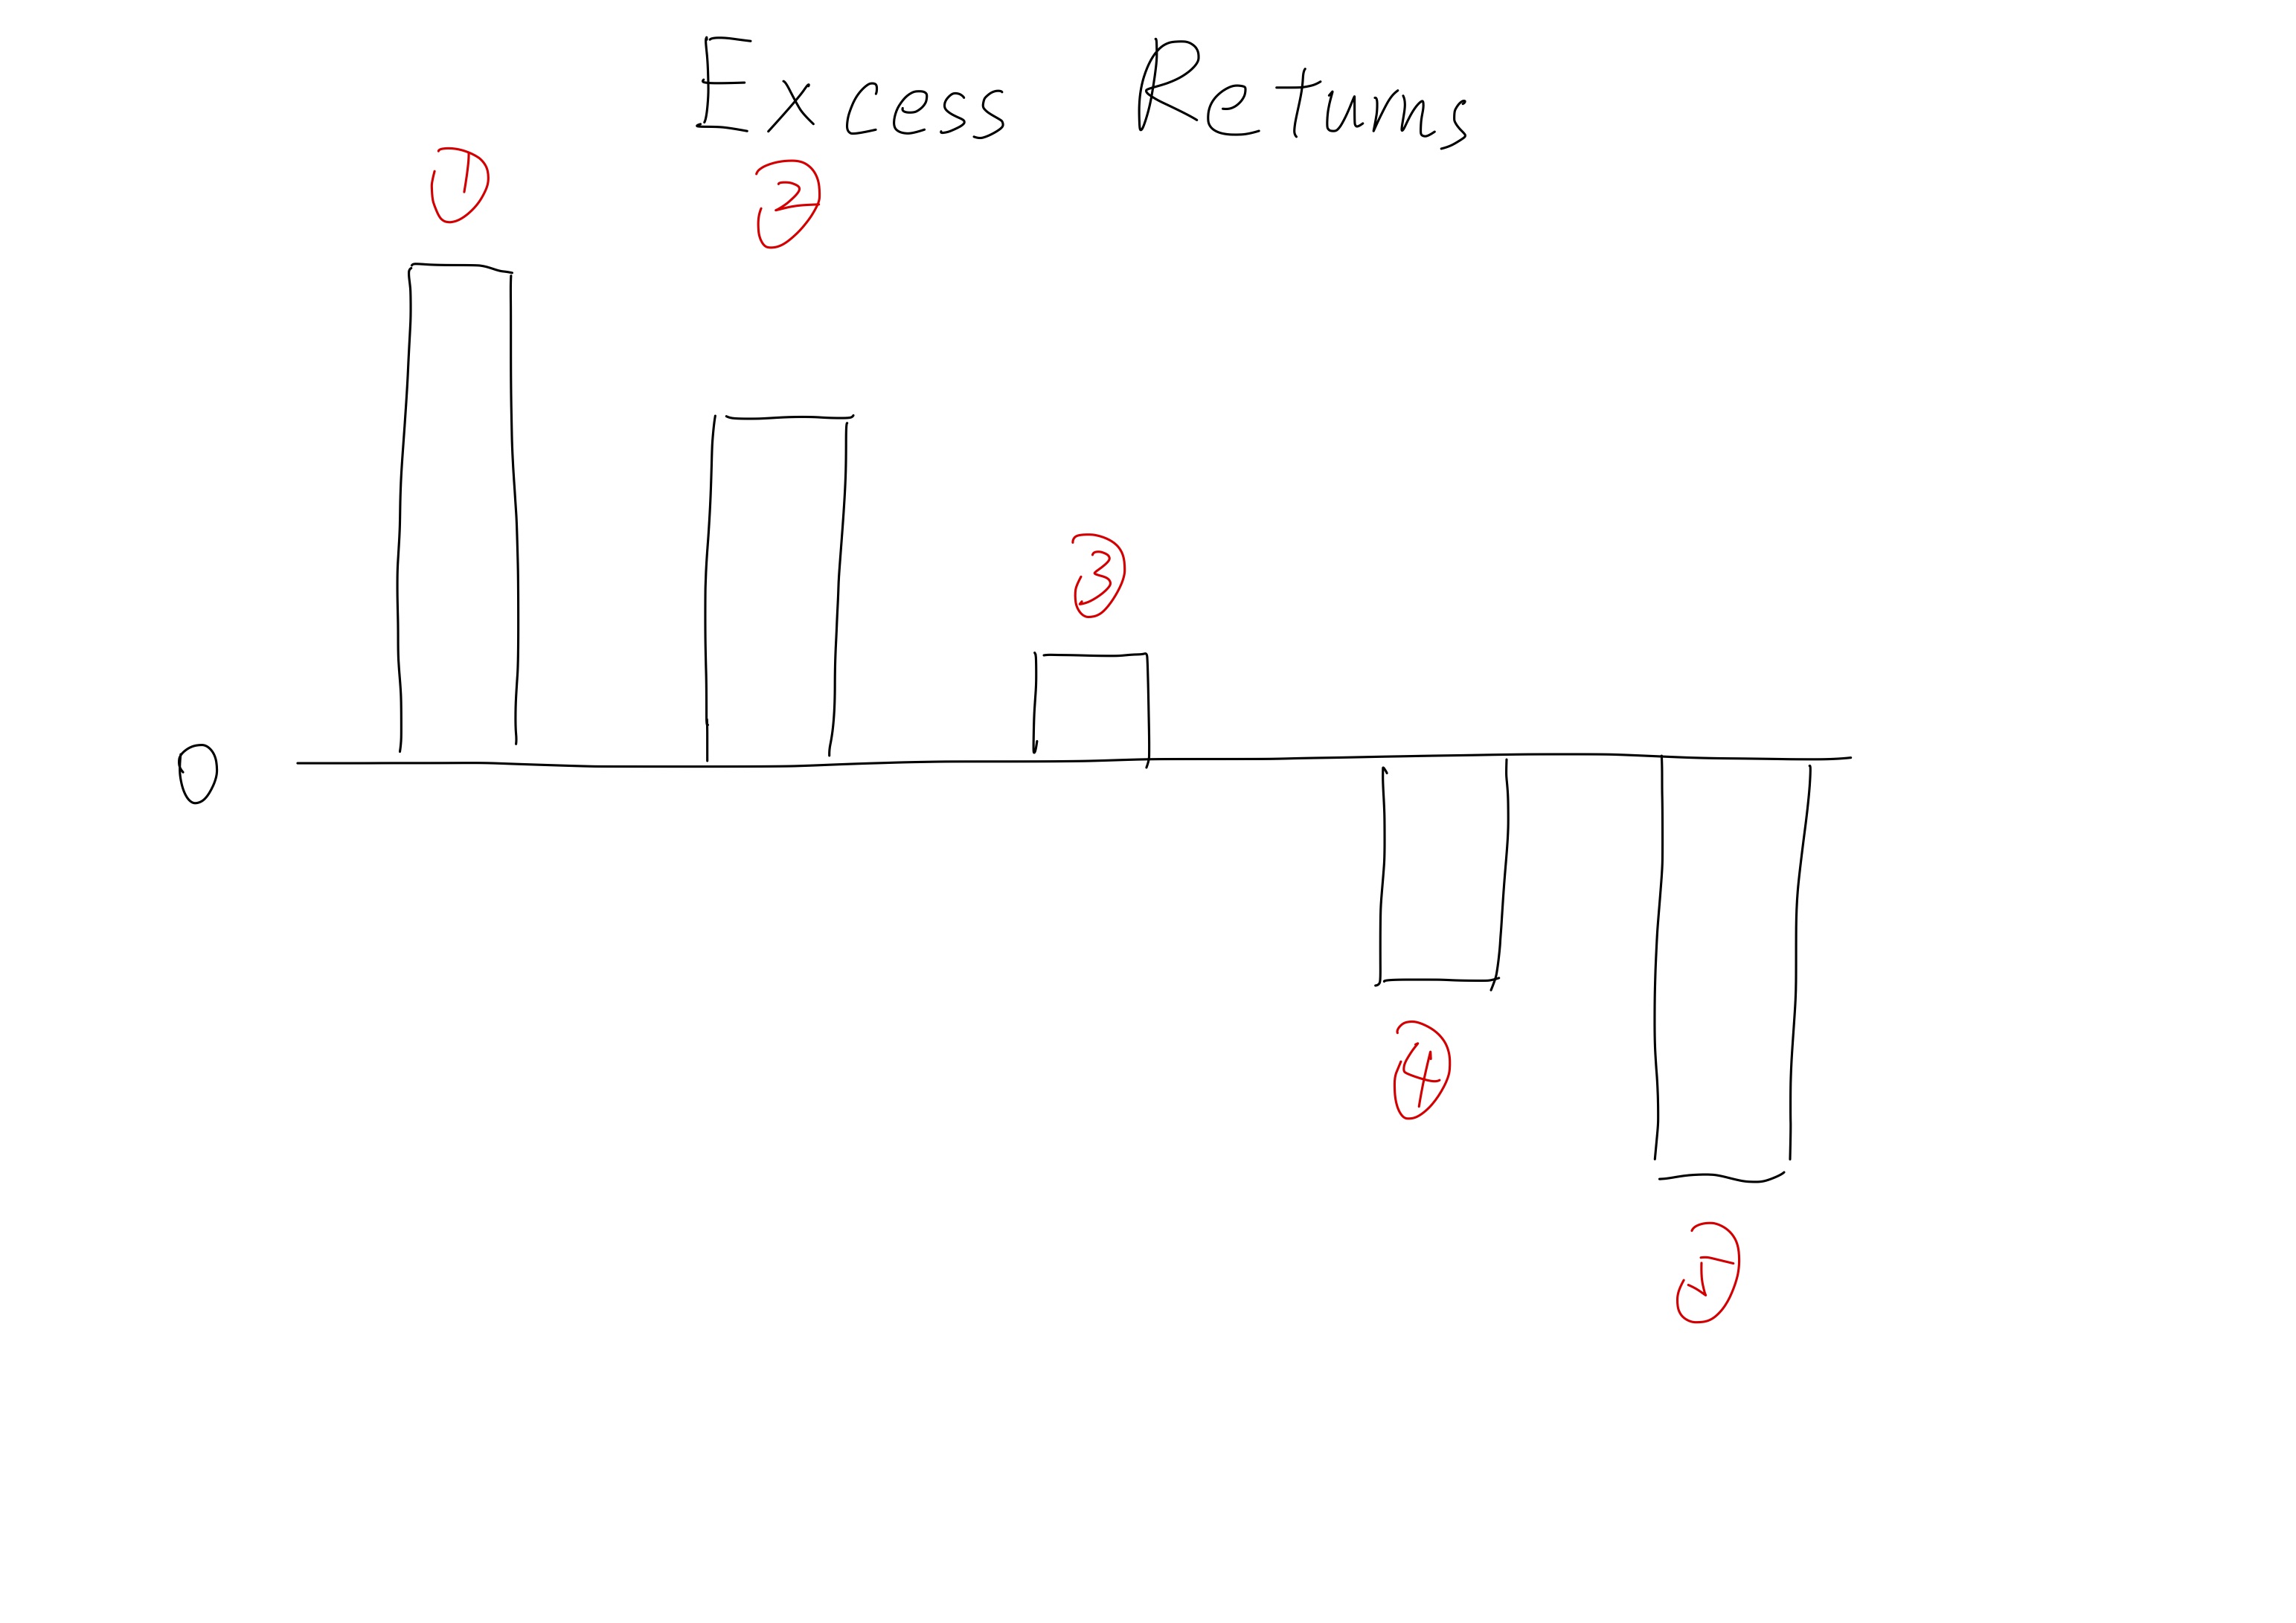
Let’s proceed to examine the following bar plot to further understand this concept.
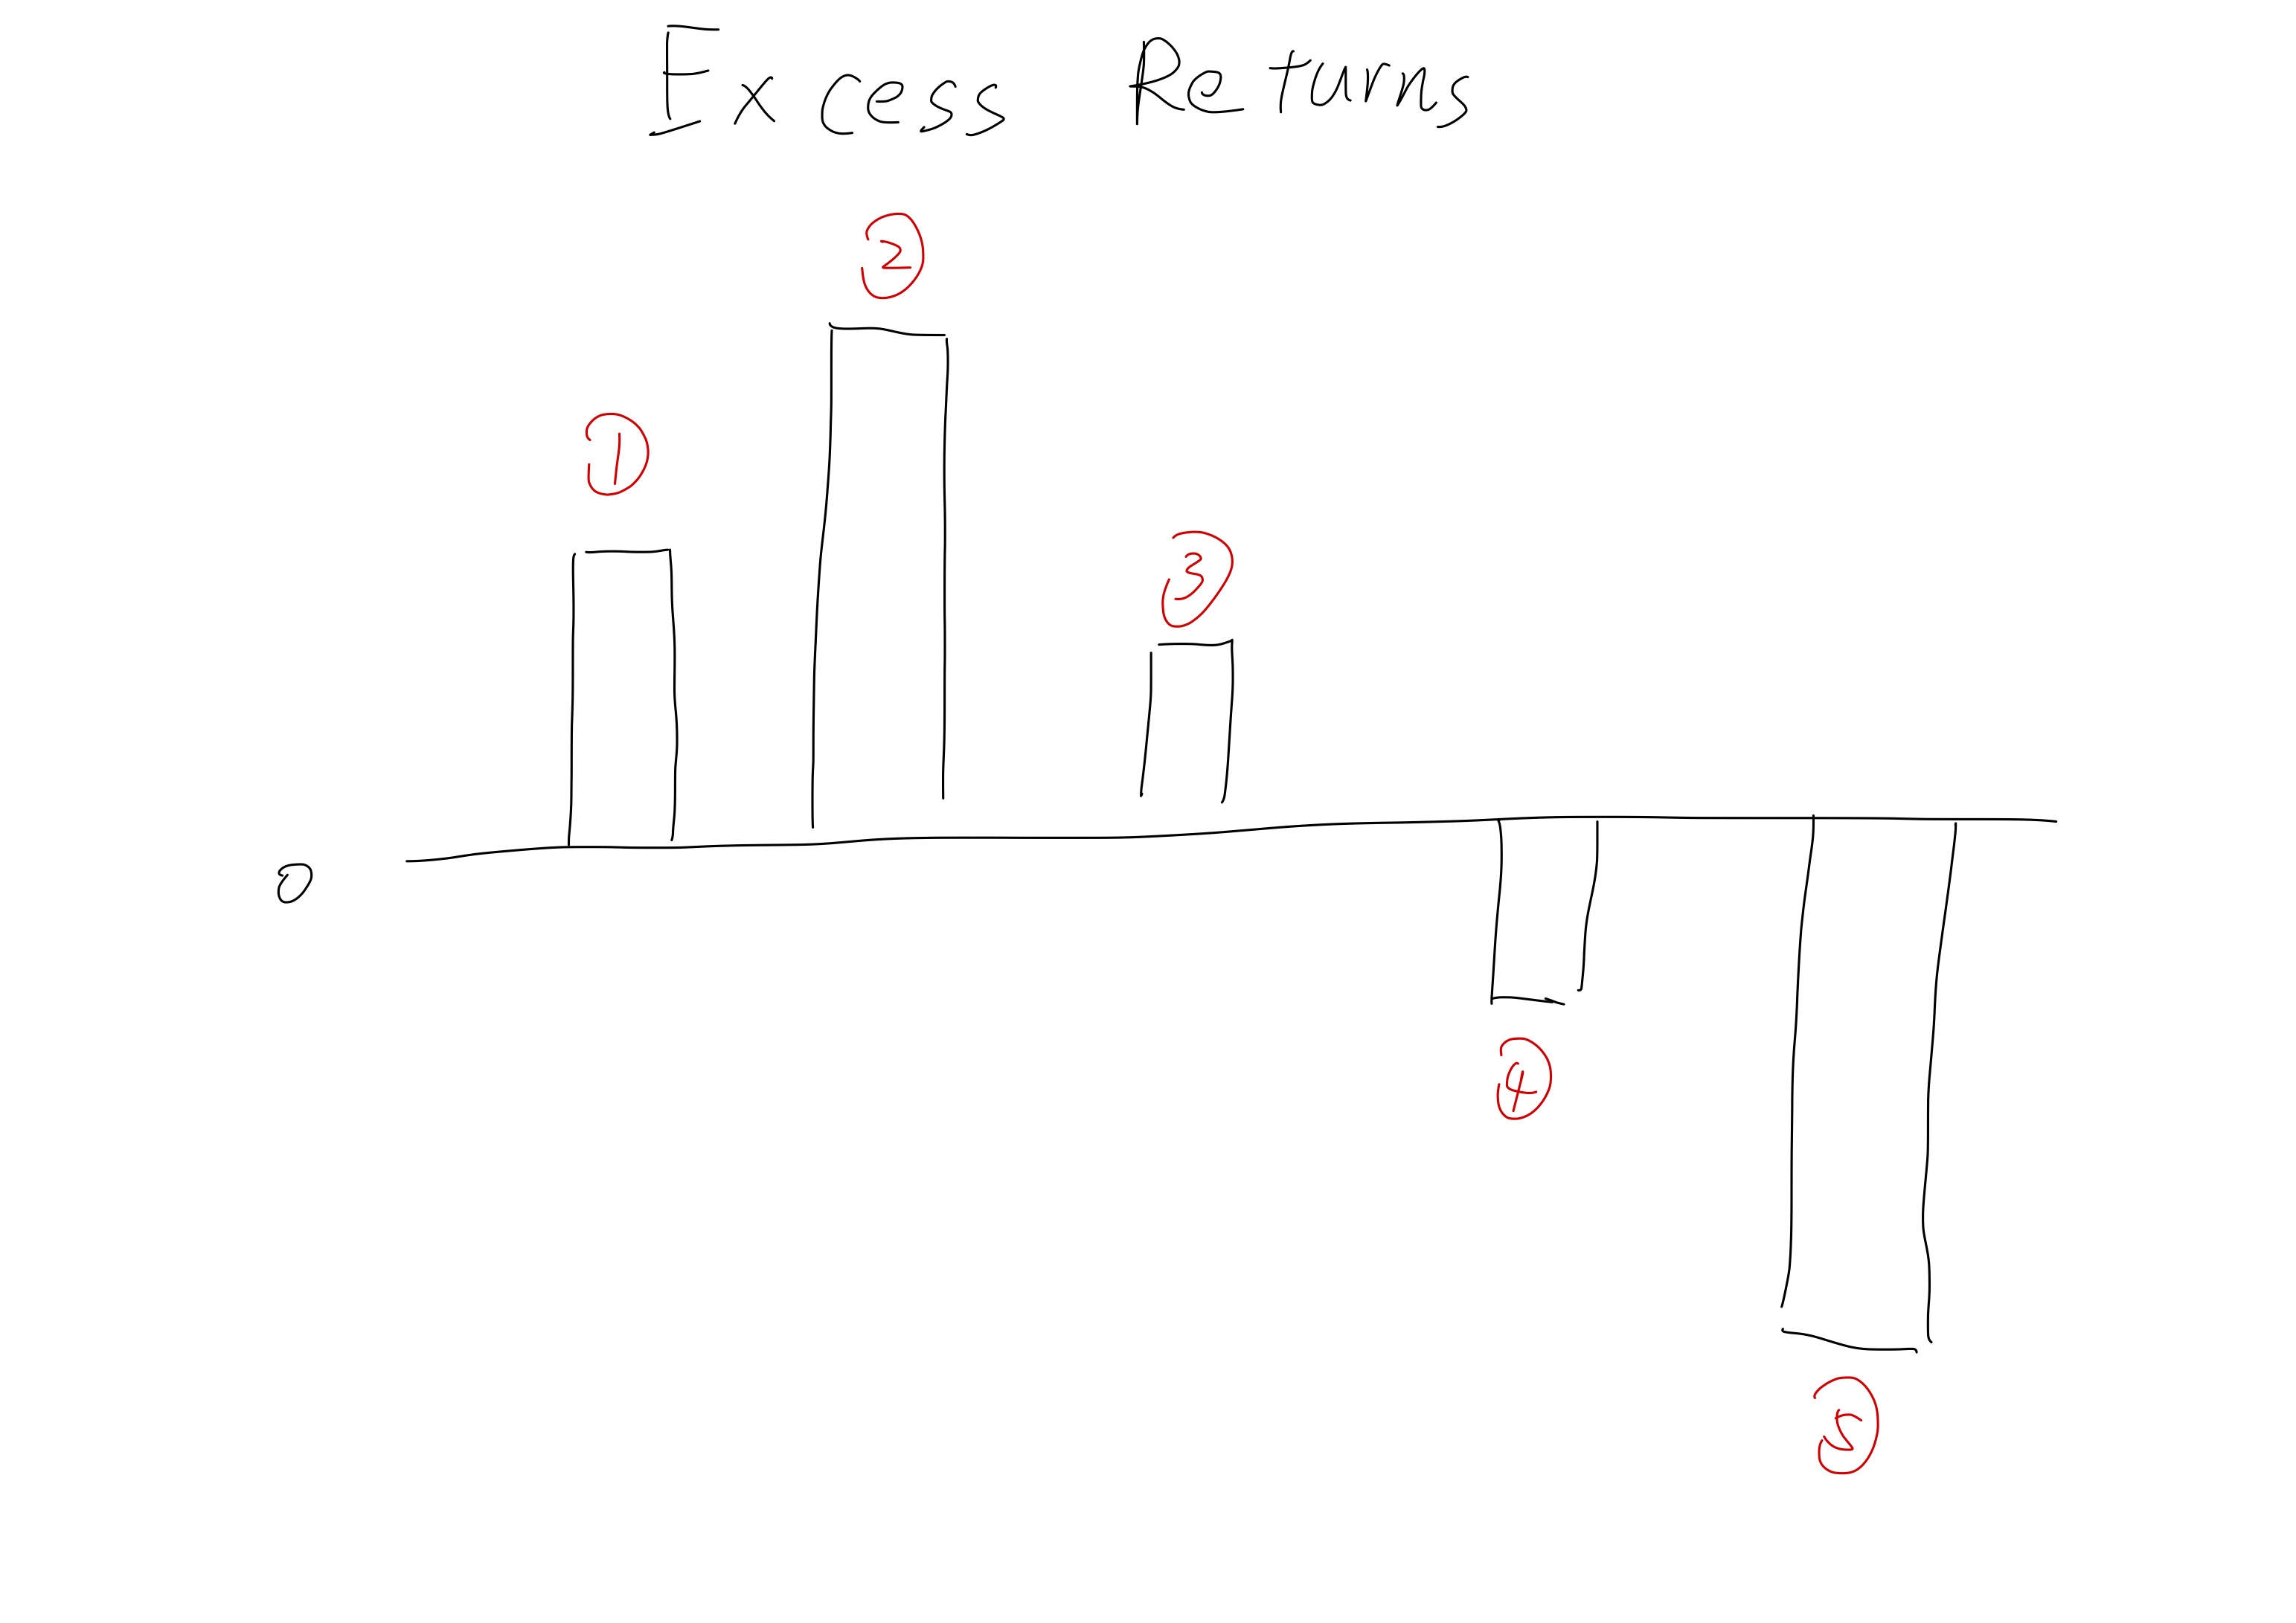
From the analysis, it is apparent that the factor under consideration may not exhibit a high Rank IC, given that Group 2 outperforms Group 1 in terms of returns, contrary to expected monotonicity. However, the performance of Groups 4 and 5 deserves our attention; these groups are observed to incur significant losses. This insight offers a valuable opportunity to enhance portfolio construction strategies by excluding stocks characterized by lower factor values, akin to those found in Groups 4 and 5. Importantly, this strategy’s effectiveness is not diminished by the less-than-anticipated predictability observed in Groups 1 through 3. Thus, even in the absence of a high Rank IC, the factor provides actionable insight that can be leveraged to improve investment decisions.
Correlation Analysis:
The issue at hand originates from a common challenge encountered in linear modeling: the detrimental impact of covariate correlation on model integrity. Within the realm of finance, this problem is exacerbated due to the pervasive correlation among data sets. Here the coorelation can be simply defined as
\[corr(X_T, Y_T )\]For instance, a general uptrend in stock prices typically triggers a unanimous indication of entry points across various famous technical analysis indicators. Similarly, Return on Equity (ROE) and Return on Assets (ROA) tend to demonstrate a high degree of correlation due to their shared numerator, diminishing the value of combining these two factors. The inclusion of ROA alongside ROE does not significantly enhance the model’s performance, as it introduces minimal new information.
To navigate this complexity in model construction, a strategic approach involves the amalgamation of factors that individually exhibit high Rank IC values yet maintain low inter-factor correlations. By adopting this methodology, it is possible to forge a composite factor of superior strength relative to its constituents. This technique enables the exploitation of unique information carried by each factor while minimizing the redundancy that typically arises from correlation, thereby optimizing the model’s predictive power and overall efficacy.
Persistence Analysis:
Factor persistence refers to the continuity of a factor’s performance over time, suggesting that if a factor exhibits a high value at time T, its favorable performance is likely to persist into time T+1. The mathematical definition is as follows:
\[corr(X_T, X_{T+1} )\]In the realm of investment, leveraging factor persistence can lead to significant gains, occasionally mirroring the advantages typically associated with insider knowledge. For instance, consider the scenario where a company is anticipated to report a substantial growth in revenue for Q2. Insiders privy to this information may commence purchasing stocks ahead of the public earnings announcement, typically disclosed in mid-May, capitalizing on their advanced knowledge. For the general public, and more critically, for quantitative investors operating within the constraints of publicly available information, the challenge lies in identifying such opportunities without access to insider information.
Quantitative investment strategies, utilizing factor persistence, offer a somehow viable solution to this challenge. By analyzing the revenue growth rate and its persistence, quantitative investors can identify promising stocks immediately following the Q1 financial disclosures, typically released at the end of April. This strategic positioning allows investors to potentially benefit from the anticipated price increase in May, all without reliance on insider information. Such an approach underscores the value of factor persistence in enhancing the predictive power of quantitative models, thereby enabling investors to make informed decisions based on observable market data and trends.